
Atour Lifestyle Holdings (NASDAQ:ATAT) has become an interesting option for investors using a high growth momentum plan joined with technical breakout formations. This technique centers on finding firms displaying solid earnings momentum and quickening growth basics while also showing good technical chart formations that indicate possible entry points. The system joins ChartMill's own ratings, High Growth Momentum (HGM) for basic growth force, Technical Rating for general trend condition, and Setup Rating for consolidation standard, to identify stocks set for possible extension of their upward movement.
High Growth Momentum Basics
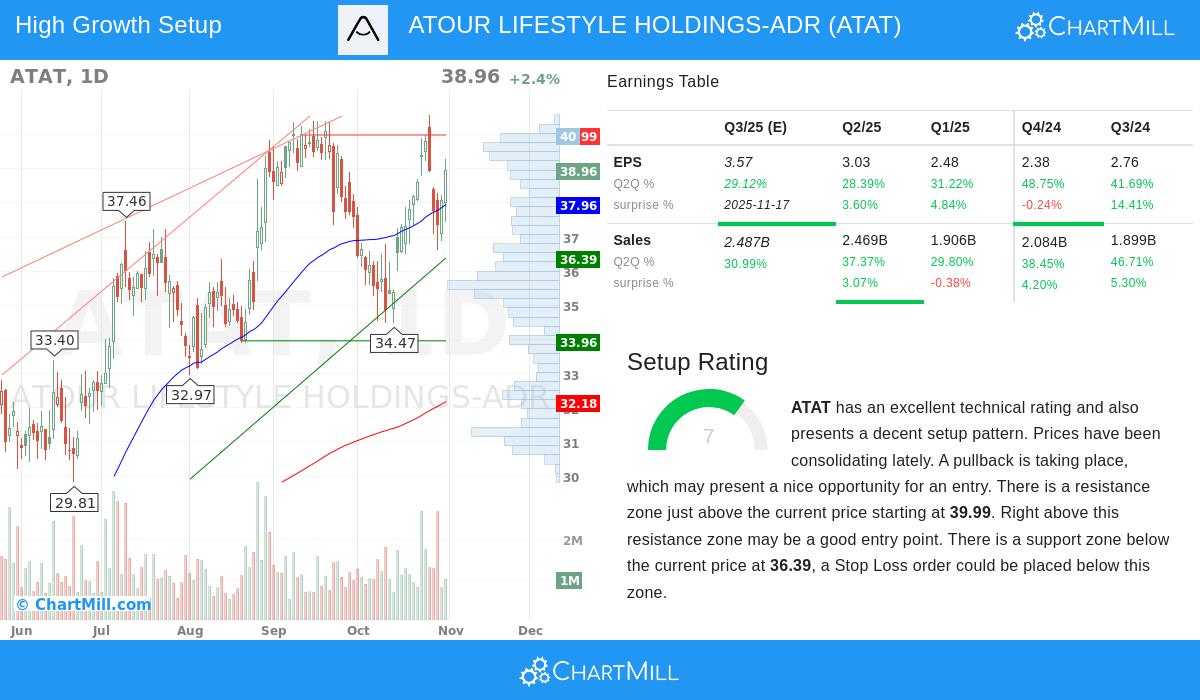
ATAT shows strong growth features that fit well with momentum investment rules. The firm's financial numbers show steady increase over different periods, showing the quickening business results that growth investors look for.
Important growth measures contain:
- EPS increase of 36.6% over the trailing twelve months
- Quarterly EPS increase rates changing from 28.4% to 48.8% over recent quarters
- Revenue increase of 37.8% over the past year with quarterly sales growth between 29.8% and 46.7%
- Free cash flow per share increase of 74% year-over-year
- Three straight quarters of earnings surprises averaging 5.65%
The firm's profit margin growth from 15.8% to 17.6% over the past year shows better operational effectiveness, while analyst changes showing 10.1% upward changes to next year's EPS estimates show increasing belief in the firm's outlook. These basic strong points add to ATAT's HGM Rating of 6, indicating above-average growth momentum that fits the filtering needs for high growth investors.
Technical Force and Market Standing
ATAT's technical outline shows a stock displaying solid trend features within its market group. The Technical Rating of 9 puts it in the top group of stocks from a technical view, backed by several good elements.
Technical strong points noted in the detailed technical analysis contain:
- Long-term trend rated as good with short-term trend neutral
- Performance standing in the top 14% of all stocks year-to-date
- Better performance than 93% of stocks in the Hotels, Restaurants & Leisure industry
- Trading in the higher part of its 52-week range
- All main moving averages (20, 50, 100, and 200-day) moving upward
The stock's relative strength number of 86.72 shows large better performance compared to the wider market. With the S&P500 showing good long and short-term trends, ATAT's technical match with the market direction gives extra proof of its force.
Setup Standard and Trading Points
The Setup Rating of 7 finds ATAT as now showing a workable consolidation formation that may give a planned entry chance for momentum investors. The technical analysis shows particular price points that describe the present formation.
Noticeable formation features contain:
- Recent trading span between $34.47 and $40.58 over the past month
- Resistance area found between $39.99 and $40.09
- Several support points between $33.96 and $36.39 giving possible stop-loss zones
- Present price consolidation after a 58.6% six-month gain
The proposed trading formation suggests an entry at $40.10, just above the resistance area, with a stop loss at $36.62. This is an 8.68% risk on the trade, which fits with common momentum trading measures. The existence of set support and resistance points makes an organized risk-reward situation that technical traders often look for.
Investment Meaning
For investors following high growth momentum plans, ATAT shows an interesting case with matched basic and technical features. The firm's solid earnings growth, margin growth, and good estimate changes give the basic foundation, while the technical formation gives a set entry point with clear risk measures. The joining of these elements indicates ATAT deserves thought for addition in growth-focused portfolios looking for firms with momentum features.
Investors curious about finding more choices fitting similar needs can look at more outcomes through the High Growth Momentum Breakout Setups screen, which often finds stocks showing both solid growth basics and good technical formations.
Disclaimer: This study is for information only and does not make up investment guidance, suggestion, or backing of any security. Investors should do their own study and talk with a skilled financial advisor before making investment choices. Past results are not a sign of future outcomes, and all investments have risk including possible loss of original amount.