
For investors looking to find high-growth market leaders, the CAN SLIM method, made known by William O'Neil, provides a structured plan. This growth investing plan uses both fundamental and technical study to locate companies with solid earnings momentum, leading traits, and institutional support, all while noting the need for a good general market trend. The plan's main filters require large quarterly and yearly earnings increases, rising sales, superior price performance, and acceptable debt, along with other factors. A recent filter using this plan has identified ASA Gold and Precious Metals Ltd (NYSE:ASA) as a possible choice that deserves more study.
Fundamental Strength and Growth Measures
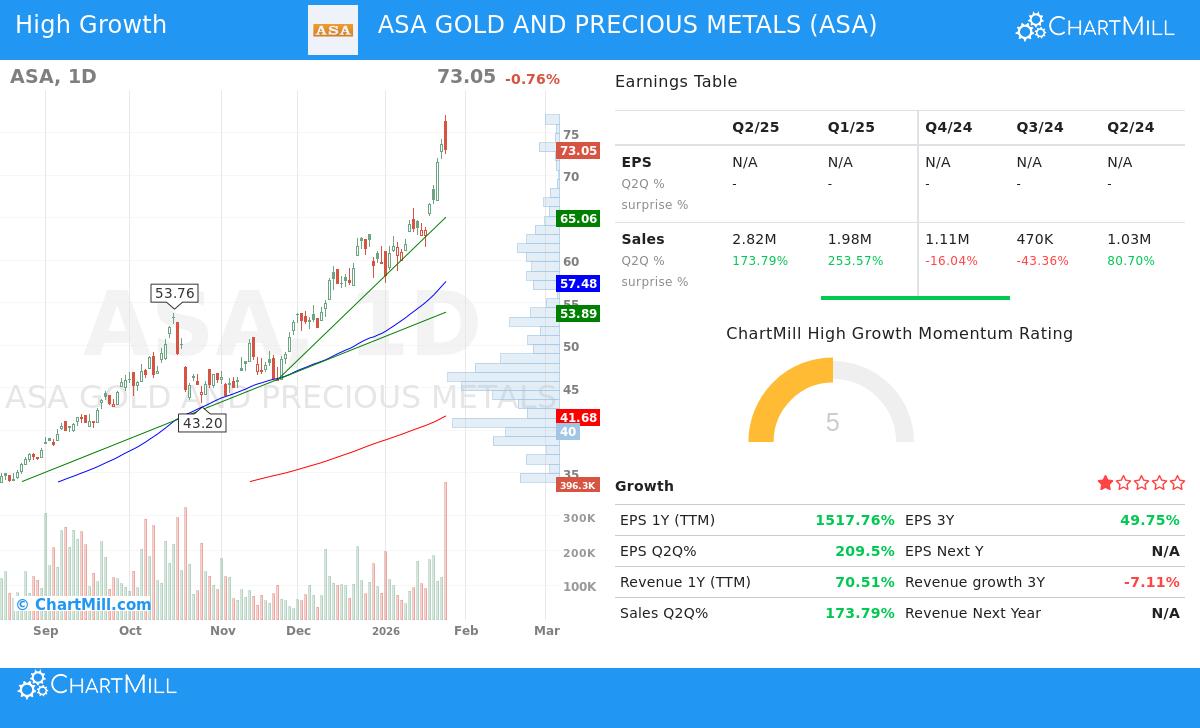
The CAN SLIM plan gives greatest importance to present and rising earnings. The "C" in the name means Current Quarterly Earnings, looking for large or speeding growth. ASA shows very strong momentum here, with its latest quarterly earnings per share jumping 209.5% against the same quarter last year. This is much higher than the usual lowest level of 18-25% the plan advises. Also, the company’s quarterly sales increase of 173.8% shows matching top-line growth to go with its bottom-line results.
The "A" rule, Annual Earnings Increases, wants a record of large growth. ASA’s three-year EPS compound annual growth rate (CAGR) is about 49.7%, which is very good and easily meets the plan's idea of 25-50%. This shows the recent quarterly jump is not a single case but part of a longer profitable pattern. The company also has a very good Return on Equity (ROE) of 54.75%, a main profit measure that is much higher than the 10% lowest filter, showing very good use of shareholder money.
Leadership and Institutional Support
A main idea of CAN SLIM is investing in market leaders, not weaker performers. The "L" means Leader, which is measured using relative strength (RS), a gauge of a stock's price action against the wider market. ASA’s relative strength score of 97.86 means it has done better than almost 98% of all stocks over the last year. This very high score is a sign of a real market leader and meets the plan's need for a high RS (usually above 75).
The "I" for Institutional Support is also satisfied. While CAN SLIM likes stocks found by institutions, it warns against those where ownership is too focused. ASA’s institutional ownership is 65.17%, which is under the 85% limit often used in filters. This indicates there is still space for more institutional purchases, which could give more upward push.
Financial Health and Price Assessment
The "S" rule is about Supply and Demand, with a focus on good financials. ASA shows a very clear balance sheet with a Debt-to-Equity ratio of 0.0, showing no debt. This not only lowers financial risk but also puts the company in a top group for financial health, fitting well with the plan's liking for low debt.
From a price view, ASA’s present Price-to-Earnings (P/E) ratio of 7.24 seems low, especially next to the S&P 500 average. However, the fundamental analysis report states that while profit health is acceptable, there are worries about the continuation of its growth, with earnings and revenue showing drops over a longer multi-year span. The dividend yield is very small, and no future analyst estimates exist, making forward growth guesses hard.
Technical View and Market Setting
The "M" in CAN SLIM tells investors to always think about the Market Trend. At present, both the short-term and long-term trends for the S&P 500 are good, giving a positive setting for growth stocks. ASA’s own technical view is very good, getting a top score of 10 out of 10 in its technical analysis report. The stock is in a solid uptrend across all time frames, is trading near 52-week highs, and has lately had a large rise in trading volume—all good technical signs.
However, the report also warns that the recent unstable price jump may need a time of settling before giving a better entry chance for new positions. This points out the CAN SLIM idea of looking for "New Highs Off Properly Formed Chart Bases," suggesting investors might wait for a more formed setup.
Summary and More Study
ASA Gold and Precious Metals gives a strong case for CAN SLIM investors based on several number-based filters:
- Very Strong Growth: Outstanding quarterly EPS (209.5%) and sales (173.8%) increases.
- Good History: A solid 3-year EPS CAGR of 49.7% and high ROE.
- Market Leadership: A top-level relative strength score of 97.86.
- Good Finances: A very clear balance sheet with no debt.
- Positive Support: Institutional ownership at a good 65.17%.
While the fundamental report brings up questions about long-term growth steadiness and the technical report suggests waiting for a better entry, the stock clearly meets the main, measurable filters of the CAN SLIM plan. Investors wanting to look at other companies that meet these structured growth rules can see the full filter results using this CANSLIM High Growth screener.
Disclaimer: This article is for information only and is not financial advice, a suggestion, or an offer to buy or sell any security. The CAN SLIM plan includes risk, including the loss of original money. Investors should do their own full study and think about their personal money situation and risk comfort before making any investment choices. Past results do not show future outcomes.