
The method of joining Mark Minervini's Trend Template with a High Growth Momentum (HGM) rating is made to find companies that are in a strong technical uptrend and also supported by fundamental speed that supports continued price gains. This two-step method tries to find leaders early in their growth phase, concentrating on stocks that show firm price movement, better relative performance, and solid, getting-better financial numbers. It is a plan that puts quality momentum first, looking to take part in the market's most active areas.
Array Technologies Inc (NASDAQ:ARRY) comes forward as a present candidate from this scan, working as a maker of ground-mounting systems for solar energy projects. The company's place in the renewable energy infrastructure field offers a clear connection to long-term structural trends, which can act as a fundamental driver for growth.
Technical Fit with the Minervini Trend Template
A main idea of the Minervini plan is to invest along the line of a set, strong trend, thus improving the chances for the trader. The Trend Template's strict rules make sure a stock is in a verified Stage 2 rise before review. ARRY's present chart shows a strong fit with these technical rules:
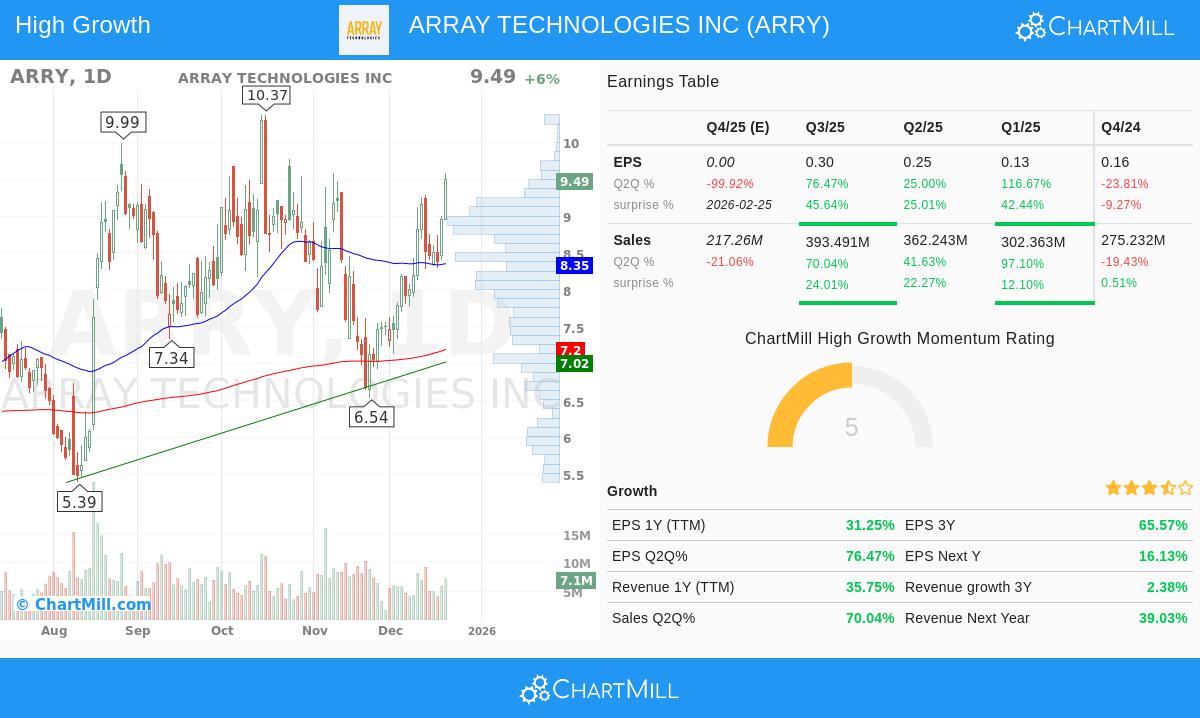
- Trending Moving Averages: The stock price ($9.49) trades well above its rising 50-day ($8.35), 150-day ($7.80), and 200-day ($7.20) simple moving averages. Importantly, the 50-day SMA is above the 150-day SMA, which is above the 200-day SMA, a classic bullish order that shows gaining speed across several time frames.
- Nearness to Highs: ARRY's present price is within 9% of its 52-week high of $10.37, well inside the Template's rule of being within 25% of the high. This shows the stock is acting as a market leader, not a follower. At the same time, the price is more than 150% above its 52-week low, showing a strong recovery trend.
- Better Relative Performance: With a ChartMill Relative Strength (CRS) score of 91.95, ARRY is doing better than about 92% of all stocks in the market over the past year. Minervini notes that the largest winners usually show high relative strength early in their advances, as it points to institutional buying and leadership.
This technical view confirms ARRY is in a clear uptrend with firm momentum, meeting the basic "trend" part of Minervini's Specific Entry Point Analysis (SEPA) method.
Fundamental Reasons for High Growth Momentum
While the Trend Template finds how a stock is moving, the High Growth Momentum rating tries to know why. It centers on the earnings and sales speed that usually comes before and pushes major price increases. ARRY's recent fundamental results show several signs of such speed:
- Earnings Speed: The company has shown major quarterly earnings growth. The latest quarter saw EPS rise 76.5% year-over-year, after a 25% rise in the quarter before and a sharp 116.7% jump the quarter before that. This sequence of firm, one-after-another growth is a main trait looked for by growth investors.
- Sales Growth & Surprises: Revenue growth has been just as solid, with the last quarter growing 70% year-over-year. Notably, ARRY has exceeded revenue estimates in each of the last four quarters, with an average beat of 14.7%, showing steady operational overperformance.
- Analyst Belief: Forward-looking estimates show positive feeling, with analysts increasing their average revenue estimate for the next fiscal year by over 5% in the last three months. Upward changes often come before more institutional interest and price momentum.
These points add to a high growth profile, speaking to the "fundamentals" and "catalyst" parts of the SEPA plan. The joining of exceeding expectations, delivering speeding growth, and working in the renewable energy field creates a strong fundamental story to support the technical strength.
Present Technical Condition and Setup Points
According to ChartMill's own analysis, ARRY presently has a top-level Technical Rating of 10 out of 10, showing very good technical condition. The report states both long-term and short-term trends are positive, with the stock doing better than most of the market and its industry group over the past year.
However, the analysis also gives a note of care for immediate entry: the Setup Quality rating is presently a 3. This shows that while the stock's trend is very good, its recent price movement has been unstable, making the finding of a low-risk, high-chance entry point difficult at this time. The report proposes waiting for a time of settling or a move back to a set support level, such as the noted areas near $8.33 or $7.55, would give a better risk/reward setup. This fits well with the Minervini idea of patience and control, waiting for a Specific Entry Point instead of following extended prices.
A full breakdown of the technical picture, including support areas and momentum indicators, is ready in the full ChartMill Technical Report for ARRY.
Summary and Plan View
Array Technologies Inc shows a case where a strong growth story in the solar field is being verified by firm price movement. It meets the strict technical rules of the Minervini Trend Template, confirming a firm Stage 2 uptrend with leadership-level relative performance. Fundamentally, it shows the earnings and sales speed that describes high-momentum growth stocks, having regularly beaten expectations.
For investors following this joined method, ARRY stands for a stock to put on a watchlist. The very good technical rating confirms its place as a market leader, but the lower setup score suggests plan patience. The best method would be to watch for the forming of a volatility shrinking pattern or a move back to support, which would give the controlled entry point that is central to risk-managed growth investing.
Interested in finding other stocks that presently pass this two-part filter of high growth and firm trend? You can run the same scan using the High Growth Momentum + Trend Template screener on ChartMill.
,
Disclaimer: This article is for informational and educational purposes only. It is not a recommendation to buy or sell any security. The analysis is based on data provided and certain screening methodologies, and it does not constitute investment advice. Investors should conduct their own research and consider their individual financial situation and risk tolerance before making any investment decisions. Please read our full disclaimer here.