
Investors looking for high-growth chances with good technical patterns might appreciate a combined method that looks at both fundamental momentum and chart setups. This process looks for companies showing solid earnings and sales speed, good analyst changes, and increasing profit margins, key parts of the ChartMill High Growth Momentum Rating. At the same time, these stocks need to show good technical health and consolidation patterns, as measured by ChartMill's Technical Rating and Setup Quality Score, to find possible breakout stocks. This two-part study tries to find stocks where fundamental growth drivers match with technically good entry points.
High Growth Momentum Fundamentals
Amphenol Corporation (NYSE:APH) makes a strong case for growth investors, getting a High Growth Momentum Rating of 8 out of 10. This score shows great strength in several fundamental growth areas that are important for momentum plans. The company's recent results show solid operational momentum.
Important fundamental growth factors are:
- Strong Earnings Growth: Quarterly EPS growth has sped up notably, with the newest quarter rising 84.1% year-over-year. This comes after earlier quarters showing growth of 57.5%, 34.1%, and 28.2%, pointing to a clear speeding-up pattern.
- Good Sales Growth: Revenue growth has also sped up, with the latest quarter growing 56.5% compared to earlier quarters showing 47.7%, 29.8%, and 26.2% growth. This steady speeding-up shows solid market need and performance.
- Positive Surprises and Changes: The company has topped EPS guesses in all of the last four quarters by an average of 15.1%, while also beating revenue guesses regularly. Analysts have lifted their forward guesses a lot, with next-year EPS guesses going up 13.6% over the past three months.
- Margin Growth: Profit margins have grown notably, with the most recent quarter hitting 19.3% compared to 15.9% in the last fiscal year, showing better operational efficiency along with fast growth.
Technical Strength and Market Position
From a technical view, Amphenol shows great strength with a perfect Technical Rating of 10. The stock shows good relative strength, doing better than 92% of all stocks in the market and ranking in the top group within its industry. Both short-term and long-term trends stay firmly positive, with the stock trading near 52-week highs while staying above all important moving averages.
The technical view shows:
- Steady Uptrend: The stock has given good returns across several time periods, including 21.6% over three months and 93.1% over six months.
- Good Support Structure: Several set support zones exist between $114.82 and $124.68, giving solid bases for the current price action.
- Market Leadership: The stock's performance matches the wider market's positive short-term trend while showing better relative strength.
Breakout Setup Quality
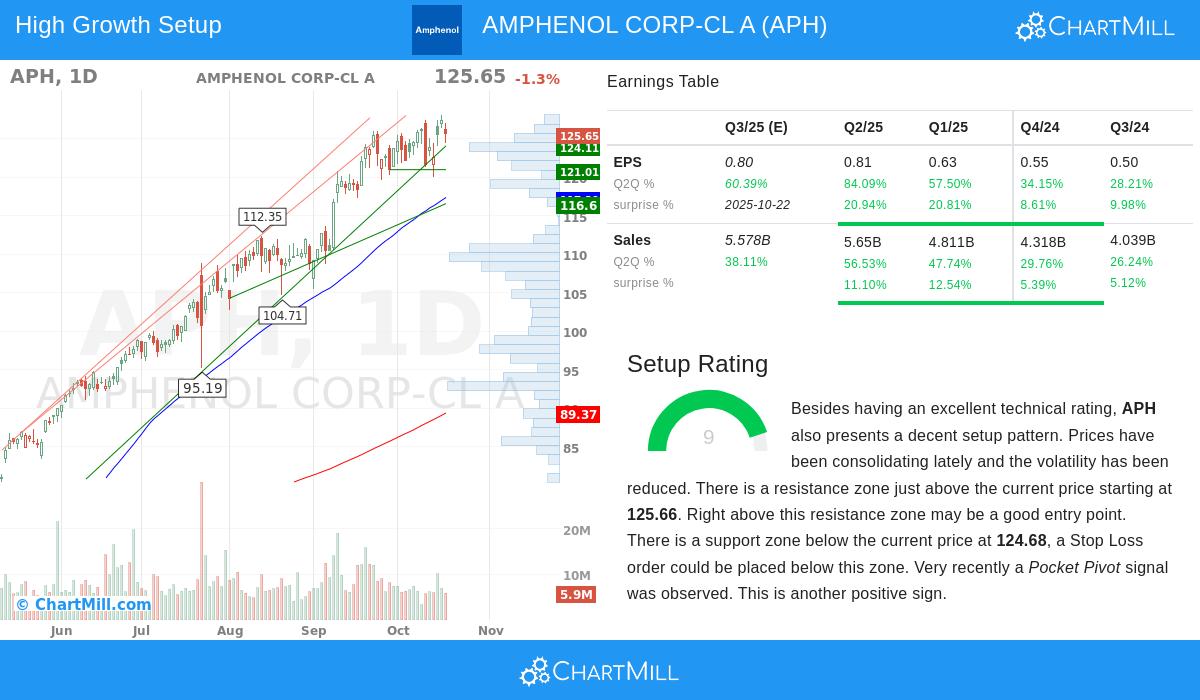
Amphenol currently shows a high-quality setup pattern with a Setup Rating of 9. The stock has been moving in a set range between $119.62 and $128.12 over the past month, showing lower volatility while making clear support and resistance levels. This consolidation time after a strong upward move makes a possible breakout chance.
The setup study suggests:
- Clear Entry and Exit Levels: Resistance sits in the $125.66 to $127.36 range, with a possible breakout entry above this zone. Support at $124.68 gives a sensible stop-loss level.
- Good Risk/Reward: The space between possible entry and stop levels is about 2.7% risk, workable for position sizing.
- Accumulation Signs: Recent pocket pivot action points to institutional buying during the consolidation time.
For investors curious about finding other high-growth momentum stocks with good technical setups, more screening results are available through the High Growth Momentum Breakout Setups Screen. This tool methodically finds companies showing both fundamental growth speeding up and technically good chart patterns.
Disclaimer: This study is based on current data and technical signs and should not be seen as investment advice. Investors should do their own research and think about their risk comfort before making any investment choices. Past results do not promise future outcomes.