
For technical investors, finding stocks that are in a solid trend and ready for further price movement is a central method. One technique uses a search for stocks that have both a high technical health score and a high setup quality rating. The first shows a solid, existing uptrend, while the second indicates the stock is moving in a narrow band, possibly preparing for a new price advance. This method finds leading stocks that are not only going up, but are doing so with order and controlled risk.
APA CORP (NASDAQ:APA) recently appeared from this search, presenting an interesting case for technical study. The independent energy company, with work centered in the Permian Basin, Egypt, and the North Sea, is displaying a strong technical picture that fits this method looking for price advances.
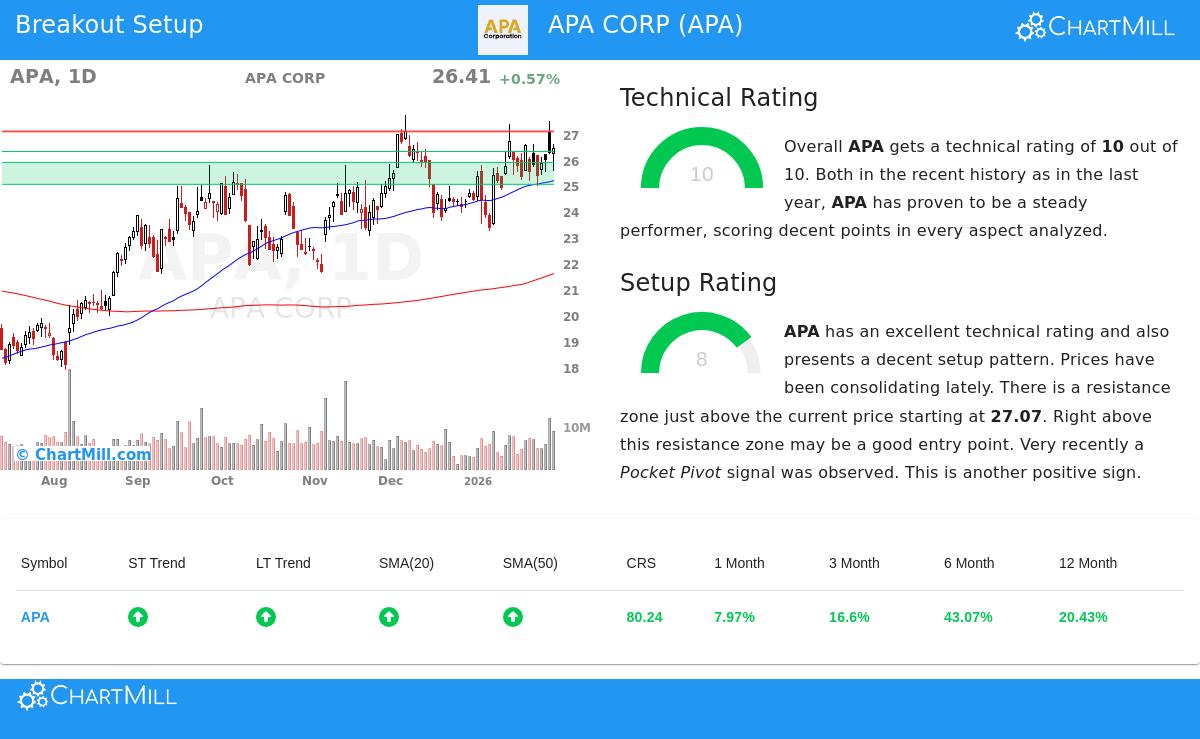
A Base of Technical Health
The main search in this method looks for stocks with a high technical rating, which measures the general health and trend force of a stock. APA Corp. performs well here, receiving a top ChartMill Technical Rating of 10. This high score comes from several areas of force that are important for maintaining a trend.
- Positive Trend Direction: Both the long-term and short-term trends for APA are seen as positive. This agreement across different time periods is a main sign of a healthy, continuing uptrend instead of a temporary rise.
- Solid Performance Comparison: The stock's performance over one year puts it above 80% of all other stocks, showing notable comparative force. It is also priced in the higher part of its own 52-week range.
- Supportive Moving Average Arrangement: APA’s price is above all its main simple moving averages (20, 50, 100, and 200-day), and each of these averages is itself moving upward. This arranged, rising moving average picture is a standard sign of a solid upward trend.
This solid technical base is necessary for the method because it directs money toward market leaders. A stock with a poor or worsening technical rating is more probable to fall short on a price advance attempt. APA’s rating of 10 indicates it has the basic force required to possibly maintain a new upward move.
A Favorable Setup for a Possible Price Advance
While a solid trend is required, it is not enough for a best entry. The second search looks for a high setup quality rating, which finds stocks that are stabilizing or holding after a move, providing a clearer entry point and a specific area for risk control. APA Corp. shows a setup rating of 8, signaling a good consolidation shape.
The technical report states that prices have been moving within a somewhat wide one-month band between $23.25 and $27.49, with the stock now priced in the middle of this area. More significantly, the study finds a clear and nearby resistance area between $27.07 and $27.10, made by a mix of trendlines. The existence of this specific resistance is important, as it creates a real level for the stock to pass to show a possible price advance.
Also, the setup summary points out a recent "Pocket Pivot" signal, a price increase on trading volume greater than the highest down volume of the previous ten days. This is often seen by technical traders as a mark of buying interest, adding a positive detail to the consolidation period.
Trade Plan and Market Setting
From this study, an example trading plan is proposed. An entry point is found just above the noted resistance at $27.11, with a stop-loss order set below a close support trendline at $26.30. This plan sets a risk of about 3% on the trade. It is important to see this is an example; traders must always decide their own entry, exit, and trade size based on their personal risk level and plan.
The wider market setting gives a generally positive background, with the S&P 500 showing a positive short-term trend. However, APA’s technical force seems to be its own story, as it is seen to be a little behind the market even with its own solid performance.
Locating Additional Ideas
The mix of a top technical rating and a favorable setup makes APA Corp. a stock worth notice for investors using this price advance method. For those wanting to find similar setups each day, the Technical Breakout Setups screen regularly searches the market for stocks meeting these strict conditions.
Disclaimer: This article is for information only and is not investment guidance, a suggestion, or an offer to buy or sell any security. The study is based on technical data and automated scoring models, which have limits. Investors should do their own research, think about their money situation and risk comfort, and talk with a qualified financial advisor before making any investment choices. Past results do not guarantee future outcomes.