
Technical investors often use systematic methods to find stocks with strong momentum and good entry points. One method uses technical health indicators with setup quality scores to find breakout chances. This method looks for stocks showing good underlying trends while also moving in a tight range, pointing to possible upward movement. By looking for high technical and setup ratings, investors can quickly find candidates that fit momentum-based trading ideas.
Technical Strength and Market Position
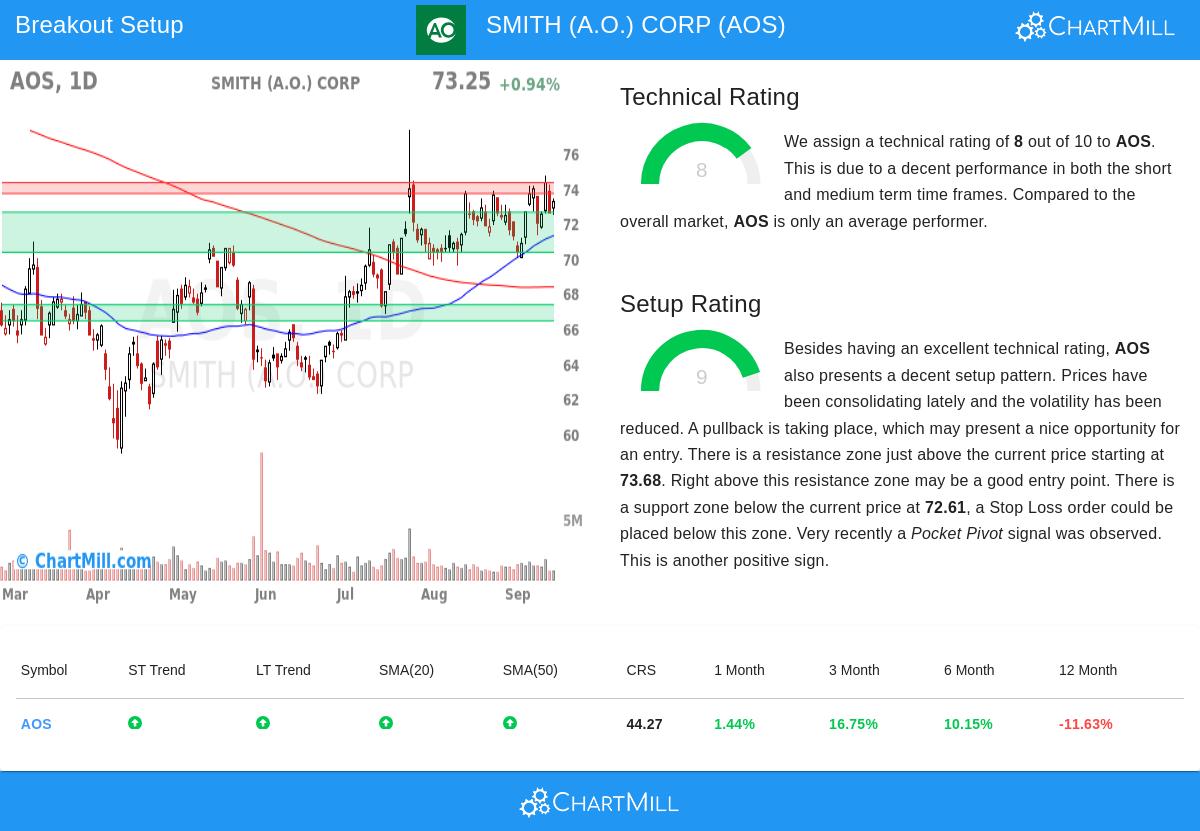
SMITH (A.O.) CORP (NYSE:AOS) shows a good technical base, getting a ChartMill Technical Rating of 8 out of 10. This score shows strength in many timeframes and technical areas, which is key for finding stocks with continued upward momentum. Important parts adding to this rating are:
- Both short-term and long-term trends are good, showing agreement across different investment timeframes.
- The stock is priced above its 20-day, 50-day, and 100-day simple moving averages, with these averages themselves in upward patterns.
- Relative strength, while not the best, puts it ahead of 44% of all stocks over the last year.
These things together suggest that AOS keeps a sound technical position, needed for lowering downside risk during possible breakout tries. The steadiness in trend and moving average support gives a buffer that technical investors often want when looking at momentum plays.
Setup Quality and Consolidation Pattern
Besides technical strength, AOS shows an interesting setup pattern, seen in its high Setup Rating of 9. This is important because even stocks with solid technicals need a clear consolidation to give a low-risk entry point. Recent trading shows:
- Prices have been moving between about $70.00 and $74.72 over the last month, pointing to lower volatility and consolidation.
- A clear resistance area is between $73.68 and $74.30, which, if broken, could mark the beginning of a new upward move.
- Support is strong near $72.61, giving a sensible level for stop-loss orders to handle risk.
Also, the presence of a Pocket Pivot signal, where price goes up on higher volume than the highest down volume of the last 10 days, adds proof that buying may be happening. This mix of tight consolidation, clear support/resistance, and positive volume behavior makes the current setup appealing for breakout plans.
Trade Structure and Risk Management
For those thinking about a position, the proposed technical setup uses a buy-stop order just above the resistance area at $74.31, with a stop-loss set below support at $69.99. This structure caps the possible loss to about 5.81% of the trade value, allowing for exact risk control, a key part of careful technical trading. Always remember that such setups are not certain, and things like coming earnings or market changes should be thought about before acting.
Exploring Additional Opportunities
Investors wanting to see similar technical breakout setups can look at the Technical Breakout Setups Screen for daily updated candidates that meet these points.
Disclaimer: This article is for informational purposes only and does not constitute investment advice. Technical analysis involves risks, and past performance is not indicative of future results. Always conduct your own research and consider consulting a financial advisor before making investment decisions.