
Consider SMITH (A.O.) CORP (NYSE:AOS) as a top pick for dividend investors, identified by our stock screening tool. AOS shines in terms of profitability, solvency, and liquidity, all while paying a decent dividend. Let's dive deeper into the analysis.
Assessing Dividend for AOS
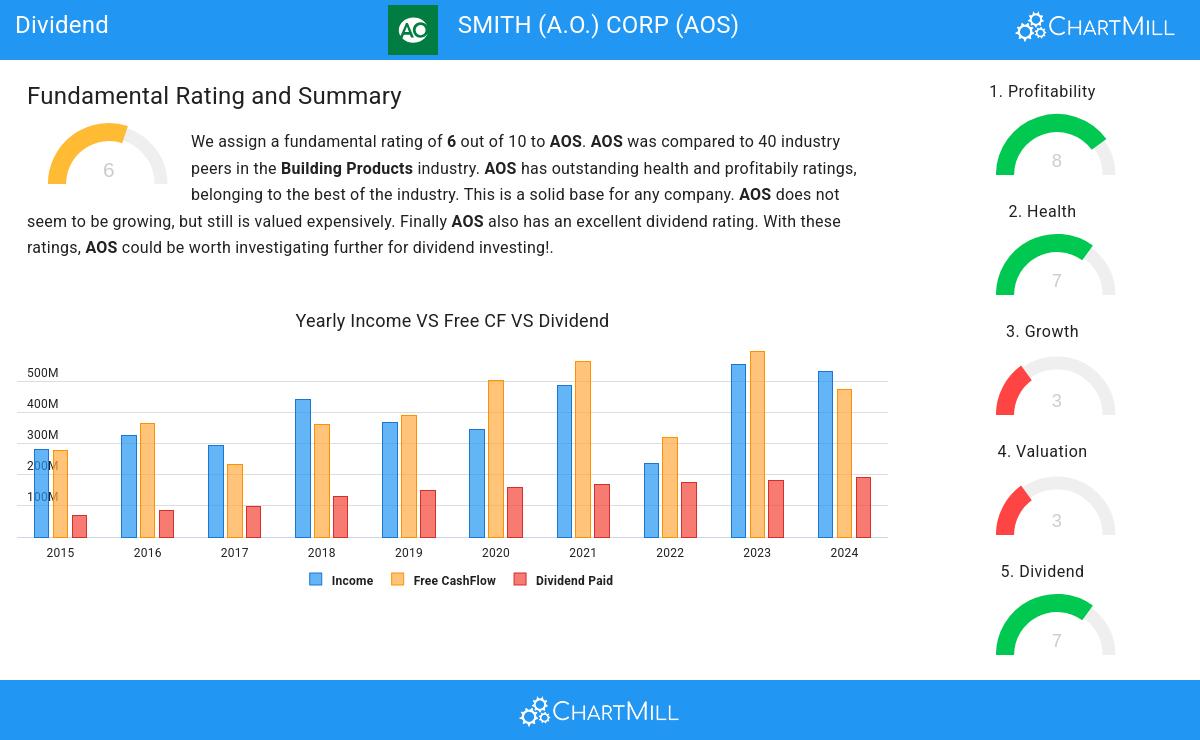
ChartMill provides a Dividend Rating for every stock, ranging from 0 to 10. This rating assesses various dividend aspects, including yield, growth, and sustainability. AOS earns a 7 out of 10:
- AOS's Dividend Yield is rather good when compared to the industry average which is at 1.19. AOS pays more dividend than 97.50% of the companies in the same industry.
- On average, the dividend of AOS grows each year by 7.65%, which is quite nice.
- AOS has been paying a dividend for at least 10 years, so it has a reliable track record.
- AOS has not decreased its dividend for at least 10 years, so it has a reliable track record of non decreasing dividend.
- AOS pays out 35.68% of its income as dividend. This is a sustainable payout ratio.
Assessing Health Metrics for AOS
To gauge a stock's financial health, ChartMill utilizes a Health Rating on a scale of 0 to 10. This comprehensive evaluation encompasses liquidity and solvency, both in absolute terms and in comparison to industry peers. AOS has earned a 7 out of 10:
- AOS has an Altman-Z score of 7.06. This indicates that AOS is financially healthy and has little risk of bankruptcy at the moment.
- The Altman-Z score of AOS (7.06) is better than 85.00% of its industry peers.
- AOS has a debt to FCF ratio of 0.41. This is a very positive value and a sign of high solvency as it would only need 0.41 years to pay back of all of its debts.
- AOS has a Debt to FCF ratio of 0.41. This is amongst the best in the industry. AOS outperforms 87.50% of its industry peers.
- AOS has a Debt/Equity ratio of 0.10. This is a healthy value indicating a solid balance between debt and equity.
- Looking at the Debt to Equity ratio, with a value of 0.10, AOS is in the better half of the industry, outperforming 75.00% of the companies in the same industry.
- The current and quick ratio evaluation for AOS is rather negative, while it does have excellent solvency and profitability. These ratios do not necessarly indicate liquidity issues and need to be evaluated against the specifics of the business.
Profitability Analysis for AOS
ChartMill utilizes a Profitability Rating to assess stocks, scoring them on a scale of 0 to 10. This rating takes into account a variety of profitability ratios and margins, both in absolute terms and in comparison to industry peers. AOS has earned a 8 out of 10:
- The Return On Assets of AOS (16.47%) is better than 92.50% of its industry peers.
- AOS has a Return On Equity of 28.33%. This is in the better half of the industry: AOS outperforms 80.00% of its industry peers.
- AOS's Return On Invested Capital of 23.53% is amongst the best of the industry. AOS outperforms 95.00% of its industry peers.
- AOS had an Average Return On Invested Capital over the past 3 years of 18.84%. This is significantly above the industry average of 12.94%.
- The 3 year average ROIC (18.84%) for AOS is below the current ROIC(23.53%), indicating increased profibility in the last year.
- The Profit Margin of AOS (13.98%) is better than 72.50% of its industry peers.
- In the last couple of years the Profit Margin of AOS has grown nicely.
- With a decent Operating Margin value of 19.00%, AOS is doing good in the industry, outperforming 75.00% of the companies in the same industry.
- In the last couple of years the Operating Margin of AOS has grown nicely.
- AOS's Gross Margin of 38.14% is fine compared to the rest of the industry. AOS outperforms 70.00% of its industry peers.
More Best Dividend stocks can be found in our Best Dividend screener.
Our latest full fundamental report of AOS contains the most current fundamental analsysis.
Disclaimer
This is not investing advice! The article highlights some of the observations at the time of writing, but you should always make your own analysis and invest based on your own insights.