
Our stock screening tool has identified AMPHASTAR PHARMACEUTICALS IN (NASDAQ:AMPH) as an undervalued gem with strong fundamentals. AMPH boasts decent financial health and profitability while maintaining an attractive price point. We'll break it down further.
What does the Valuation looks like for AMPH
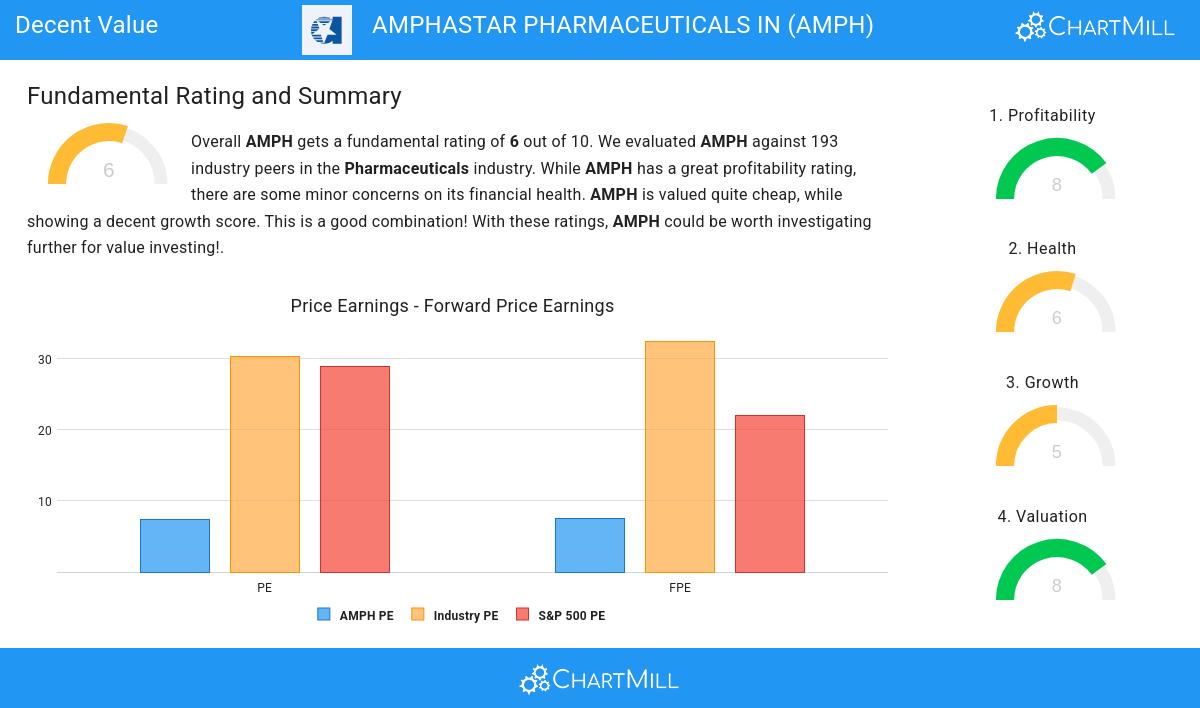
ChartMill assigns a Valuation Rating to every stock. This score ranges from 0 to 10 and evaluates the different valuation aspects and compares the price to earnings and cash flows, while taking into account profitability and growth. AMPH scores a 8 out of 10:
- AMPH is valuated cheaply with a Price/Earnings ratio of 7.35.
- 93.78% of the companies in the same industry are more expensive than AMPH, based on the Price/Earnings ratio.
- Compared to an average S&P500 Price/Earnings ratio of 28.89, AMPH is valued rather cheaply.
- The Price/Forward Earnings ratio is 7.58, which indicates a rather cheap valuation of AMPH.
- Based on the Price/Forward Earnings ratio, AMPH is valued cheaply inside the industry as 91.71% of the companies are valued more expensively.
- Compared to an average S&P500 Price/Forward Earnings ratio of 21.98, AMPH is valued rather cheaply.
- Based on the Enterprise Value to EBITDA ratio, AMPH is valued cheaper than 93.26% of the companies in the same industry.
- Compared to the rest of the industry, the Price/Free Cash Flow ratio of AMPH indicates a rather cheap valuation: AMPH is cheaper than 94.30% of the companies listed in the same industry.
- The excellent profitability rating of AMPH may justify a higher PE ratio.
- A more expensive valuation may be justified as AMPH's earnings are expected to grow with 15.20% in the coming years.
Assessing Profitability for AMPH
ChartMill assigns a Profitability Rating to every stock. This score ranges from 0 to 10 and evaluates the different profitability ratios and margins, both absolutely, but also relative to the industry peers. AMPH scores a 8 out of 10:
- AMPH has a Return On Assets of 10.11%. This is amongst the best in the industry. AMPH outperforms 92.75% of its industry peers.
- With an excellent Return On Equity value of 21.78%, AMPH belongs to the best of the industry, outperforming 93.78% of the companies in the same industry.
- Looking at the Return On Invested Capital, with a value of 12.13%, AMPH belongs to the top of the industry, outperforming 89.12% of the companies in the same industry.
- AMPH has a Profit Margin of 21.79%. This is amongst the best in the industry. AMPH outperforms 93.26% of its industry peers.
- AMPH's Profit Margin has improved in the last couple of years.
- Looking at the Operating Margin, with a value of 28.06%, AMPH belongs to the top of the industry, outperforming 93.26% of the companies in the same industry.
- In the last couple of years the Operating Margin of AMPH has grown nicely.
- AMPH's Gross Margin of 51.08% is fine compared to the rest of the industry. AMPH outperforms 62.69% of its industry peers.
- AMPH's Gross Margin has improved in the last couple of years.
Health Analysis for AMPH
To gauge a stock's financial health, ChartMill utilizes a Health Rating on a scale of 0 to 10. This comprehensive evaluation encompasses liquidity and solvency, both in absolute terms and in comparison to industry peers. AMPH has earned a 6 out of 10:
- AMPH's Altman-Z score of 2.63 is fine compared to the rest of the industry. AMPH outperforms 73.06% of its industry peers.
- The Debt to FCF ratio of AMPH is 3.49, which is a good value as it means it would take AMPH, 3.49 years of fcf income to pay off all of its debts.
- With an excellent Debt to FCF ratio value of 3.49, AMPH belongs to the best of the industry, outperforming 90.16% of the companies in the same industry.
- A Current Ratio of 3.07 indicates that AMPH has no problem at all paying its short term obligations.
- AMPH has a Quick Ratio of 2.19. This indicates that AMPH is financially healthy and has no problem in meeting its short term obligations.
Growth Examination for AMPH
A key component of ChartMill's stock assessment is the Growth Rating, which spans from 0 to 10. This rating evaluates diverse growth factors, such as EPS and revenue growth, considering both past performance and future projections. AMPH has received a 5 out of 10:
- The Earnings Per Share has grown by an nice 16.97% over the past year.
- Measured over the past years, AMPH shows a very strong growth in Earnings Per Share. The EPS has been growing by 61.62% on average per year.
- Looking at the last year, AMPH shows a quite strong growth in Revenue. The Revenue has grown by 13.59% in the last year.
- The Revenue has been growing by 17.82% on average over the past years. This is quite good.
Our Decent Value screener lists more Decent Value stocks and is updated daily.
Check the latest full fundamental report of AMPH for a complete fundamental analysis.
Disclaimer
Important Note: The content of this article is not intended as trading advice. It is essential to perform your own analysis and exercise caution when making trading decisions. The article presents observations created by automated analysis but does not guarantee any trading or investment outcomes. Always trade responsibly and make independent judgments.
