
For technical investors, finding stocks that are in a solid uptrend and ready for their next upward phase is a constant task. The aim is to locate market leaders that are pausing, holding gains in a narrow band, before possibly moving to new highs. A structured way to do this uses screening for two key proprietary measures: a high ChartMill Technical Rating, which verifies the basic trend strength, and a high ChartMill Setup Quality Rating, which finds orderly holding patterns giving defined entry and exit points. This process removes weak or overstretched stocks, concentrating instead on those with the greatest chance of a good technical move.
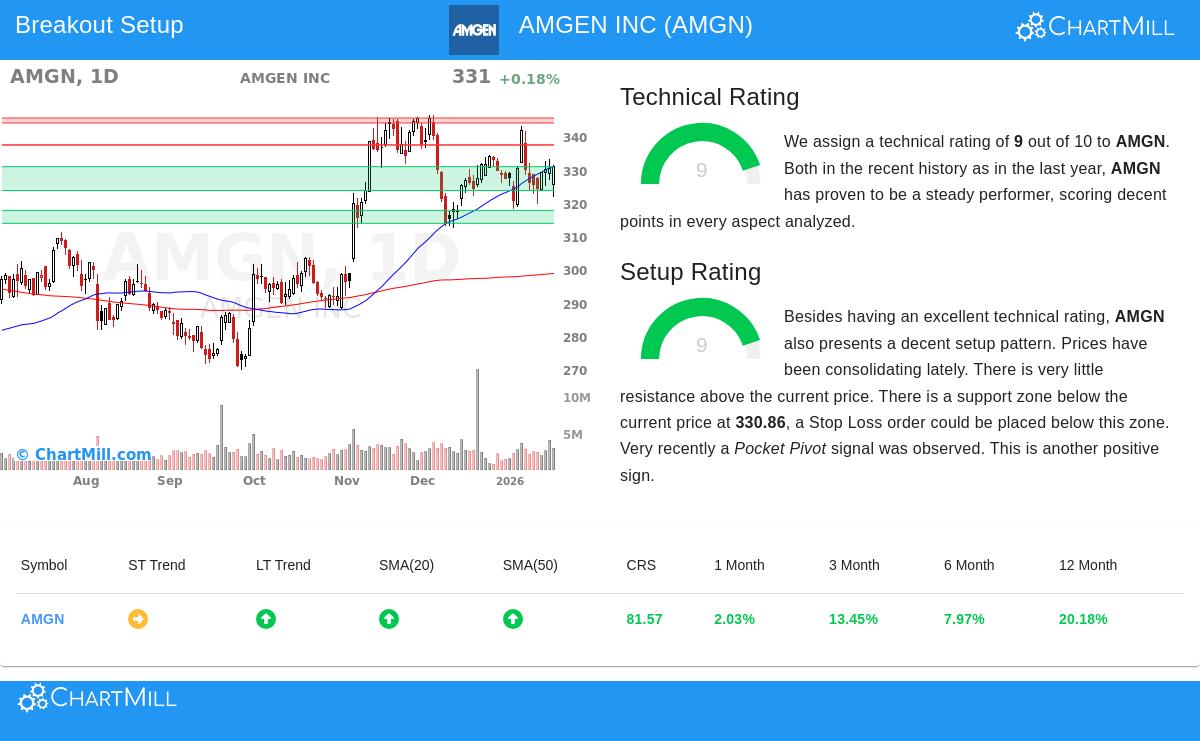
AMGEN INC (NASDAQ:AMGN) now appears as a leading case of such a pattern, receiving top scores in both important groups. A full technical analysis report gives the biotech company a Technical Rating of 9 and a Setup Quality Rating of 9, putting it with the market's most interesting technical situations.
Technical Strength: The Base of the Trend
The ChartMill Technical Rating of 9 is a solid score that measures the general condition and speed of AMGN's price movement. This high rating is not given easily; it shows continued strength across various time periods and technical measures. For a breakout plan, a firm technical base is required, it makes sure an investor is moving with the existing market speed instead of opposing it.
The report notes several supports for this firm rating:
- Long-Term Trend: The long-term trend for AMGN is seen as positive, a key part for any continued upward action. This is visually supported by the stock trading well above its main moving averages (SMA20, SMA50, SMA100, and SMA200), all of which are in rising arrangements.
- Relative Strength: AMGN is doing better than 81% of all stocks in the market over the last year, a clear mark of institutional support and leadership. Its increases have been steady and well-spread over that time.
- Price Position: The stock is trading in the higher part of its 52-week range, showing it is in a positive stage. While it notes AMGN is a bit behind the S&P 500's recent new highs, its firm independent trend stays in place.
Setup Quality: Finding the Holding Pattern
While a firm trend is needed, buying at the correct time within that trend is what divides good technical entries from bad ones. This is where the Setup Quality Rating of 9 becomes key. This score finds times of price holding, periods when a stock absorbs its past gains and forms a base for its next rise. A high setup score indicates the stock is tightening, with less movement and a clear support level, giving a defined risk point for traders.
AMGN's present chart shows these precise traits:
- Narrow Trading Band: Over the last month, AMGN has been holding within a set band between about $318 and $343. The report notes it is now trading in the center of this band, having moved back from the upper edge, which can offer a possible entry chance.
- Defined Support and Resistance: The analysis finds a firm support area between $323.68 and $330.86, made by a meeting of trendlines and moving averages. Just above the present price, resistance is noted near $337.38. This creates a clear technical plan: a move above resistance could mark the next upward action, while staying above support confirms the holding pattern's condition.
- Supportive Signs: Adding more confidence, the report marks a recent "Pocket Pivot" sign, a price and volume pattern often showing gathering by larger participants during a holding phase.
A Possible Technical Pattern
From this analysis, a specific technical picture forms. The automated report proposes a possible trading pattern with an entry order just above the noted resistance at $337.39, expecting a confirmed move. A stop-loss order would sensibly be placed just below the main support area at $323.67, setting the trade's risk. The space between these two points shows a measured risk of about 4.1%. This ordered way shows how the Technical and Setup ratings are used together to create a rule-based entry with a set exit plan.
AMGN shows a high-condition technical pattern, joining a strong long-term uptrend with a present time of orderly holding. For investors using technical breakout plans, it shows the kind of chance screens are made to find, a leader in a firm trend, taking a break that may come before its next important action.
Find more possible breakout patterns daily by visiting the Technical Breakout Setups screen.
,
Disclaimer: This article is for information only and is not investment advice, a suggestion, or an offer to buy or sell any security. The technical analysis and described pattern are based on automated measures and past data, which are not promises of future results. Always do your own research, think about your money situation and risk comfort, and talk with a qualified money advisor before making any investment choices.