
Technical analysis gives investors tools to find possible trading chances by looking at price patterns and market trends. One known method uses screening for stocks showing both good technical condition and consolidation patterns that hint at coming breakouts. This method uses the ChartMill Technical Rating, which looks at overall trend strength and momentum, with the Setup Quality Rating that finds times of price compression often before big moves. By looking at securities with high scores in both groups, investors can find instruments set for possible upward movement while controlling risk with clear support levels.
AMETEK INC (NYSE:AME) appears as a noteworthy candidate under this method, showing traits that deserve notice from technically-focused investors. The company, which makes electronic instruments and electromechanical devices for aerospace, medical, and industrial markets, shows a technical picture indicating possible readiness for movement.
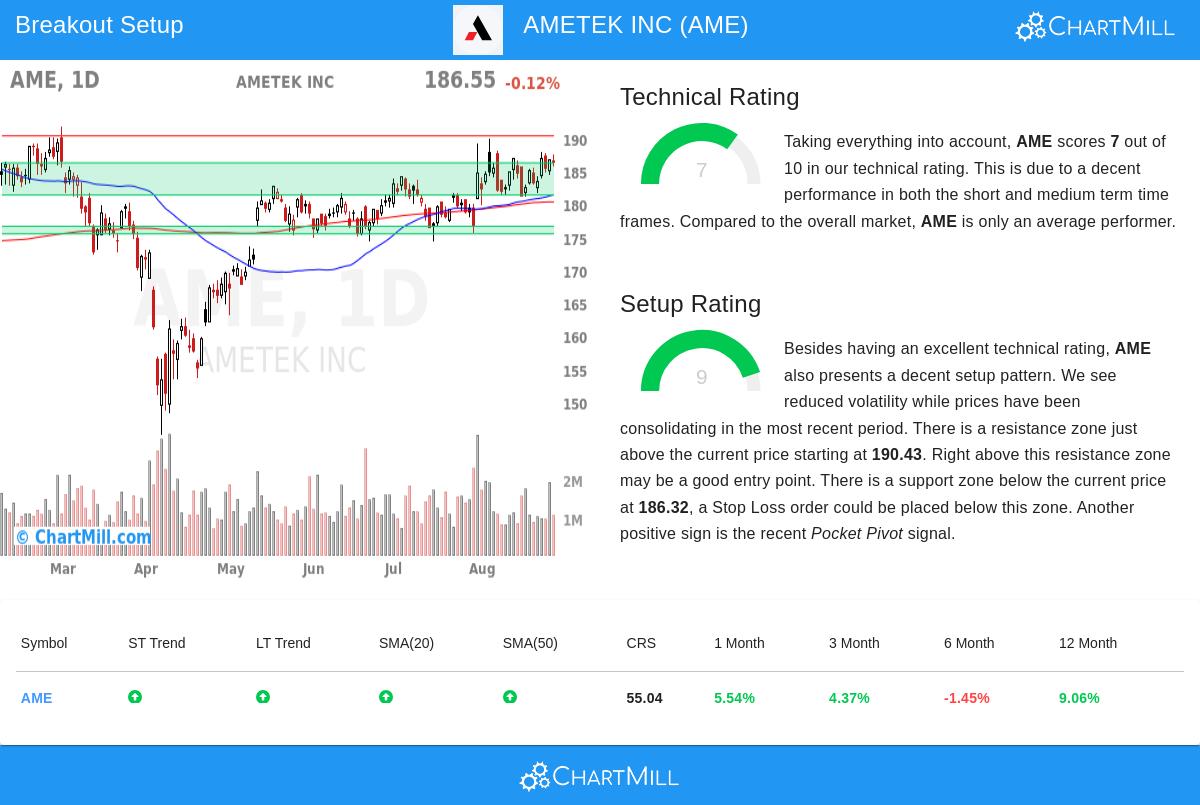
Technical Strength and Trend Analysis AMETEK's Technical Rating of 7 shows good basic technical condition, especially important since both short-term and long-term trends stay positive according to the detailed technical report. This alignment across timeframes is meaningful because steady trend strength over different periods frequently points to lasting momentum instead of brief changes. The stock trades above important moving averages including the 20-day SMA at $184.37, 50-day SMA at $181.48, and 100-day SMA at $176.29, showing price action staying above these key levels. While the stock shows average relative strength doing better than 55% of the market, its place in the higher part of its 52-week range hints at a kept upward tendency even without yet testing recent highs.
Setup Quality and Consolidation Pattern The notable aspect for AMETEK is its Setup Rating of 9, pointing to excellent consolidation traits. The stock has been trading in a narrow range between $179.90 and $190.00 over the last month, showing lower volatility while keeping its place near the top of this range. This compression pattern is especially significant because times of low volatility after upward movement often come before big breakout moves. The setup review finds a clear resistance area around $190.43, with a support area between $181.44 and $186.32 giving a reasonable place for stop placement. Also, the existence of a recent Pocket Pivot signal, where price moves up on volume greater than the highest down volume of the prior ten days, suggests institutional buying happening during this consolidation period.
Risk Management Considerations For traders looking at this setup, the technical analysis indicates a possible entry above the $190.43 resistance level with a stop loss placed below the support area. This gives specific risk measures of about 4.73% on the trade, allowing for exact position sizing based on personal risk tolerance. The average daily volume of 1.37 million shares gives enough liquidity for entry and exit. It is important to note that while the technical view looks positive, investors should stay mindful of wider market conditions and any company-specific news that could affect price action.
Investors wanting to find similar technical breakout chances can see more screening results using the Technical Breakout Setups screener, which often finds securities showing both good technical ratings and high-quality setup patterns.
Disclaimer: This analysis uses technical indicators and historical price patterns and should not be seen as investment advice. All investments have risk, and past performance does not ensure future results. Investors should do their own research and think about their personal financial situation before making any investment decisions.