
In this article we will dive into APPLIED MATERIALS INC (NASDAQ:AMAT) as a possible candidate for quality investing. Investors should always do their own research, but we noticed APPLIED MATERIALS INC showing up in our Caviar Cruise quality screen, which makes it worth to investigate a bit more.
Exploring Why AMAT Holds Appeal for Quality Investors.
- The 5-year revenue growth of AMAT has been remarkable, with 13.22% increase. This showcases the company's strong performance in driving revenue growth and indicates its competitiveness within the market.
- AMAT demonstrates impressive performance in terms of ROIC excluding cash and goodwill, with a 50.36% ratio. This highlights the company's efficient utilization of capital and its focus on maximizing returns for investors.
- AMAT demonstrates a well-balanced Debt/Free Cash Flow Ratio of 1.05, indicating effective debt management and strong cash flow generation. This ratio suggests the company has a sustainable financial position and the capacity to allocate capital efficiently.
- AMAT demonstrates consistent Profit Quality over the past 5 years, with a strong 92.06%. This indicates the company's ability to generate sustainable and reliable profits, showcasing its long-term profitability and financial stability.
- AMAT has experienced impressive EBIT growth over the past 5 years, with 18.52% increase. This reflects the company's effective operational performance and highlights its potential for long-term financial success.
- AMAT demonstrates a remarkable trend where its EBIT 5-year growth exceeds its Revenue 5-year growth. This indicates the company's ability to enhance its profitability through improved cost control and operational efficiency.
What is the full fundamental picture of AMAT telling us.
ChartMill employs a sophisticated system to assign a Fundamental Rating to every stock in its analysis. This rating, which ranges from 0 to 10, is determined by carefully assessing multiple fundamental indicators and properties.
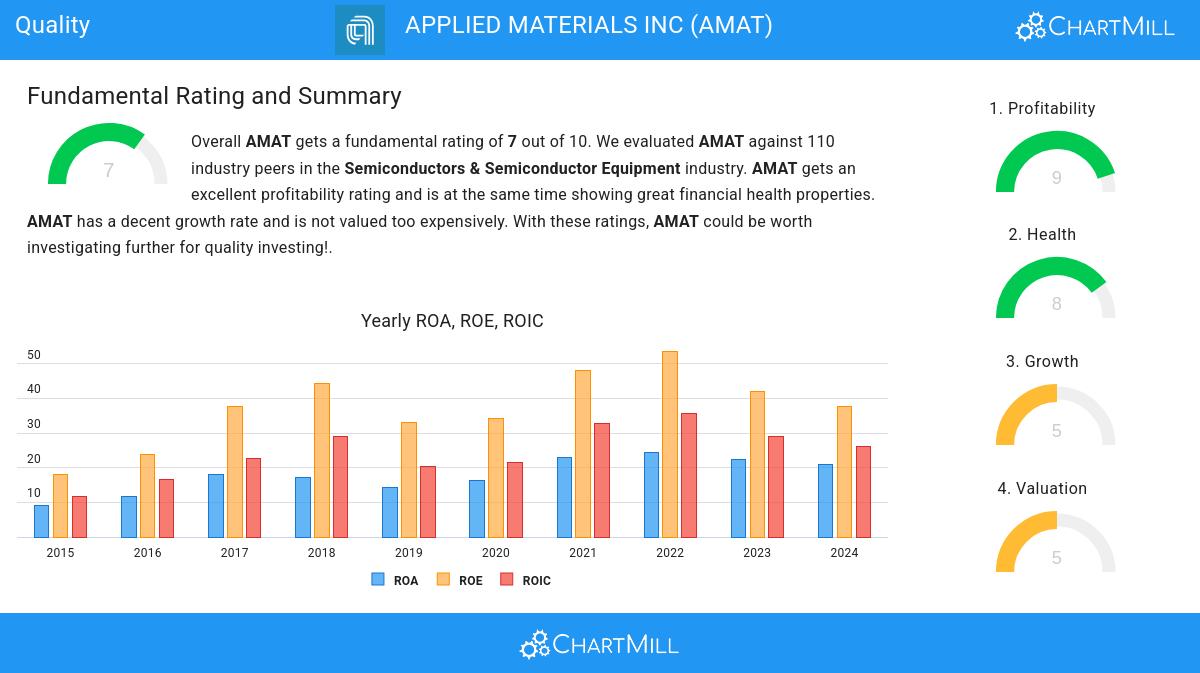
We assign a fundamental rating of 7 out of 10 to AMAT. AMAT was compared to 110 industry peers in the Semiconductors & Semiconductor Equipment industry. AMAT gets an excellent profitability rating and is at the same time showing great financial health properties. AMAT has a decent growth rate and is not valued too expensively. With these ratings, AMAT could be worth investigating further for quality investing!.
For an up to date full fundamental analysis you can check the fundamental report of AMAT
Our Caviar Cruise screen will find you more ideas suited for quality investing.
Keep in mind
Important Note: The content of this article is not intended as trading advice. It is essential to perform your own analysis and exercise caution when making trading decisions. The article presents observations created by automated analysis but does not guarantee any trading or investment outcomes. Always trade responsibly and make independent judgments.