
Technical analysis investors often look for stocks showing both good underlying momentum and good entry points. The ChartMill Technical Breakout method handles this by combining two proprietary metrics: the Technical Rating, which measures a stock's overall technical condition and trend strength, and the Setup Quality Rating, which measures the condition of its current consolidation pattern. Stocks with high scores in both areas are marked as potential breakout candidates, indicating they have both the momentum for a continued move and a specific, lower-risk entry point. A recent screen using this method has found Agnico Eagle Mines Ltd (NYSE:AEM) as fitting these strict conditions.
Technical Strength and Trend Analysis
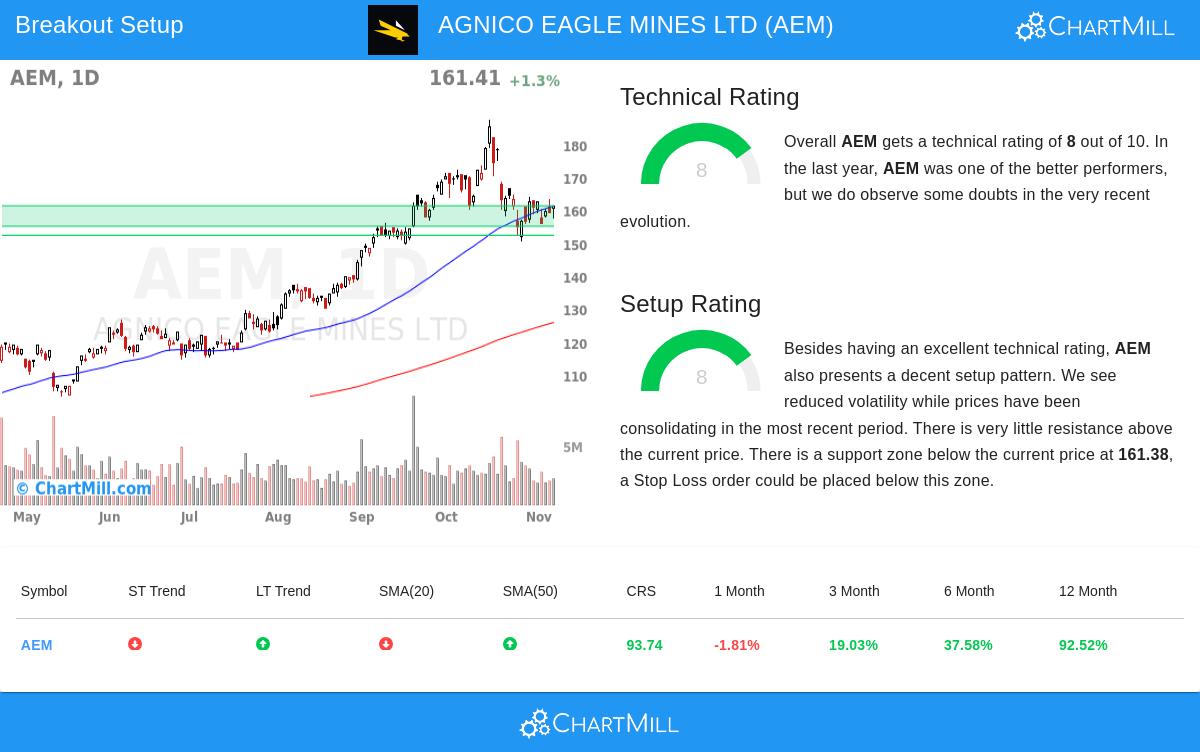
Agnico Eagle Mines Ltd shows a solid technical profile, receiving a high Technical Rating of 8. This score indicates a stock in a strong uptrend with better performance than the wider market. The rating comes from a detailed study of trend, moving averages, and relative strength.
Key elements adding to this high rating are:
- Impressive Long-Term Performance: In the last year, AEM has performed better than 93% of all stocks, showing very good relative strength.
- Positive Long-Term Trend: The long-term trend is confirmed as positive, with the stock trading well above its important long-term moving averages (SMA100 and SMA200), which are both increasing.
- Market-Aligned Positioning: AEM is now trading in the upper part of its 52-week range, a position it shares with the S&P 500, showing it is matching the general market's strength.
This firm technical base is important for the breakout strategy, as it confirms the stock is already in a confirmed uptrend, raising the chance that a breakout from consolidation will result in a continuation of that trend. A full breakdown of these technical elements is available in the full ChartMill Technical Report.
Setup Quality and Consolidation Pattern
While a strong trend is necessary, a good entry point is also very important. AEM does well here too, having a Setup Quality Rating of 8. This high score shows the stock is forming a clear consolidation pattern, marked by lower volatility and a narrow trading range, which frequently comes before a notable price change.
The current setup for AEM shows several positive features:
- Defined Support Zone: The analysis finds a firm support zone between $155.16 and $161.38, formed by a combination of trendlines and moving averages. This gives a clear level for setting a protective stop-loss order.
- Reduced Volatility: Recent trading has shown a narrowing in price movement, a common signal of consolidation before a potential breakout.
- Minimal Overhead Resistance: There is very little resistance seen above the current price, indicating a clear path upward if a breakout happens.
This high-condition setup directly answers the "when to buy" question by identifying a period of balance. It lets traders specify an exact entry point just above the recent range and a reasonable exit point below the confirmed support, successfully controlling risk.
Trading Considerations and Market Context
Based on the mix of its strong technicals and high-condition setup, a sample trading plan can be formed. This illustrative example proposes an entry point on a breakout above $163.98, with a stop-loss order set below the key support at $155.15. It is important to recognize that the short-term trend for AEM is currently negative, which differs from the positive long-term trend. This situation can often be seen during a consolidation phase inside a larger uptrend and is exactly what the setup rating tries to find.
The wider market context is also applicable. While the S&P 500's long-term trend is neutral, its short-term trend is positive, giving a generally favorable setting for breakout setups to form.
For investors and traders looking for other opportunities with a similar profile, new potential breakout candidates are found daily. You can find the most current results by running the Technical Breakout Setups screen.
Disclaimer: This article is for informational purposes only and does not constitute investment advice of any kind. The trading setup mentioned is an automatically generated example for educational purposes and is not a recommendation. All investments involve risk, and you should conduct your own research and consult with a qualified financial advisor before making any investment decisions.