
Technical investors often look for stocks showing both solid basic momentum and defined consolidation patterns that indicate possible breakout chances. One methodical process uses filters to find securities with good technical ratings, which assess general trend condition, paired with notable setup quality marks that point to positive price foundations. This system helps separate equities that are not just in confirmed upward trends but are also creating formations that provide acceptable risk-reward entry spots.
AMEREN CORPORATION (NYSE:AEE) currently shows a noteworthy case following this plan, receiving a technical rating of 8 and a setup quality mark of 9. This pairing indicates the utility stock has both the basic health and the tactical arrangement that technical breakout investors usually look for.
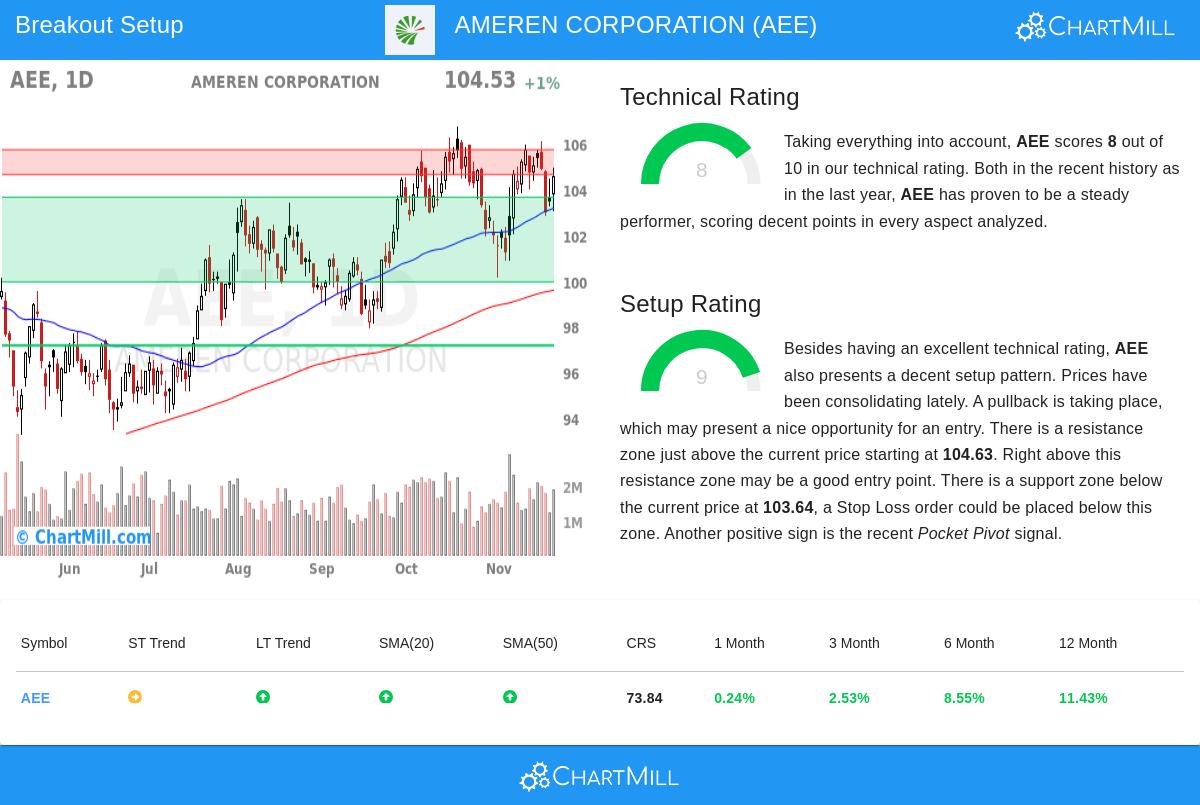
Technical Strength Evaluation
Ameren's technical base seems solid, with its rating of 8 showing good multi-timeframe momentum. This mark is important for the breakout plan since it verifies the stock is in a confirmed upward trend, raising the chance that a breakout will result in continued upward price movement instead of failing into a bigger downward trend. The detailed technical report shows a number of positive elements:
- The long-term trend is clearly positive while the short-term trend has turned neutral, indicating the stock could be pausing inside a larger upward move
- Price action stays positive with the stock trading in the upper part of its 52-week range, performing similarly to the wider market
- All main moving averages (20, 50, 100, and 200-day) are increasing and placed below the present price, forming several levels of possible support
- The stock shows relative strength, doing better than 73% of all stocks over the last year and placed in the top group of its multi-utilities industry
Setup Quality and Pattern Development
With a setup mark of 9, Ameren displays the kind of consolidation formation that technical traders prefer before possible breakouts. This high mark shows the stock has been trading in a narrow range lately, which helps establish clear support and resistance levels needed for handling risk. The setup quality is especially significant because it finds times when a stock is "coiling" after prior gains, possibly building force for its next directional price move.
The technical analysis shows Ameren has been consolidating between $100.14 and $106.08 over the last month, with a few important features:
- A clear resistance area between $104.63 and $105.72, formed by the meeting of several technical elements
- Three separate support areas below the present price, with the most important ranging from $99.95 to $103.64
- A recent pocket pivot signal, showing institutional accumulation often happening before notable price moves
- The stock is currently pulling back toward support, which could offer an acceptable risk-reward situation for entry
Trading Considerations
For investors using this breakout system, Ameren's profile indicates a possible setup with an entry point just above the resistance area at $105.73. This level marks a breakout confirmation point where the stock would move past a major technical barrier. The nearness of support around $103.64 gives a sensible area for stop placement, making a specific risk parameter of about 2.76% on the trade.
The pairing of solid basic technical factors with a good-quality consolidation formation makes Ameren worth attention for technical investors. While the wider market shows mixed signs with a negative long-term S&P 500 trend but positive short-term momentum, Ameren's sector-defensive qualities and technical setup could offer an interesting chance independent of the general market conditions.
For investors looking for related technical breakout chances, other candidates can be located using the Technical Breakout Setups screen, which methodically finds stocks with both good technical ratings and high-quality setup formations.
Disclaimer: This analysis is based on technical indicators and pattern recognition and should not be considered investment advice. All trading and investment decisions involve risk, and readers should conduct their own research and consult with a qualified financial advisor before making any investment decisions. Past performance is not indicative of future results.