
Uncover the hidden value in AXCELIS TECHNOLOGIES INC (NASDAQ:ACLS) as our stock screening tool recommends it as an undervalued choice. ACLS maintains a robust financial position and offers an attractive pricing perspective. Let's dig deeper into the analysis.
Understanding ACLS's Valuation Score
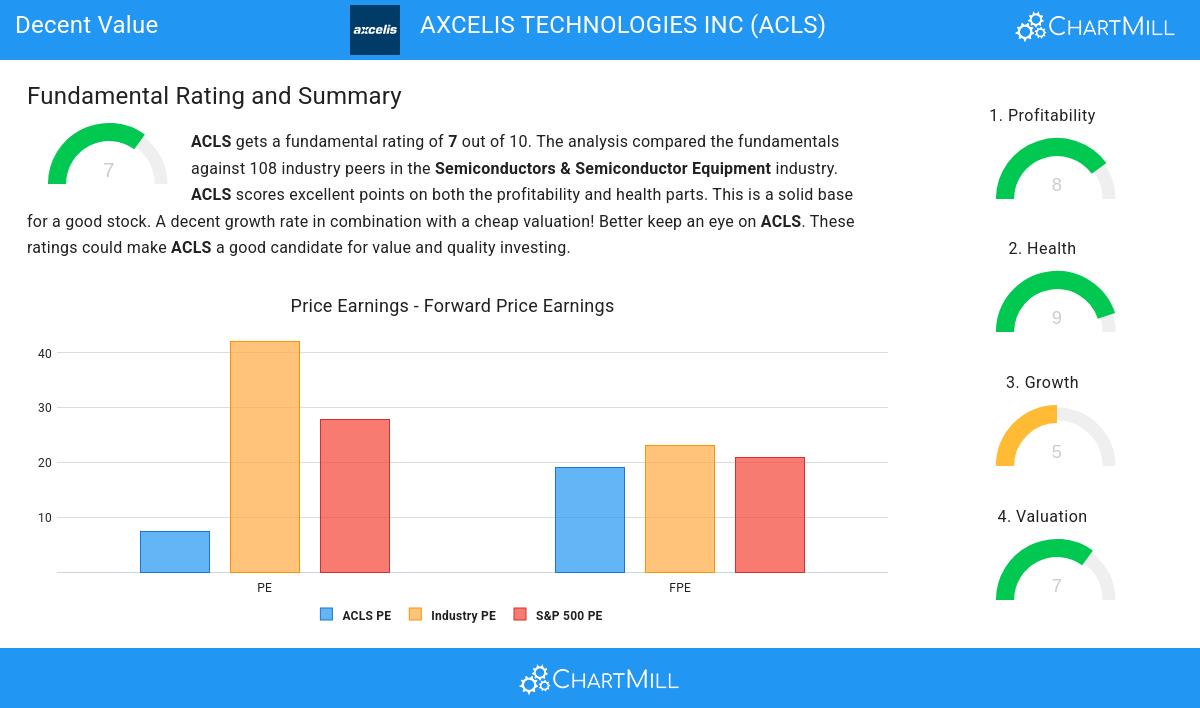
ChartMill assigns a Valuation Rating to each stock, ranging from 0 to 10. This rating is calculated by analyzing different valuation elements, such as price to earnings and free cash flow, both in absolute terms and relative to the market and industry. In the case of ACLS, the assigned 7 reflects its valuation:
- A Price/Earnings ratio of 7.35 indicates a rather cheap valuation of ACLS.
- Based on the Price/Earnings ratio, ACLS is valued cheaply inside the industry as 98.15% of the companies are valued more expensively.
- ACLS's Price/Earnings ratio indicates a rather cheap valuation when compared to the S&P500 average which is at 27.72.
- ACLS's Price/Forward Earnings ratio is a bit cheaper when compared to the industry. ACLS is cheaper than 70.37% of the companies in the same industry.
- 96.30% of the companies in the same industry are more expensive than ACLS, based on the Enterprise Value to EBITDA ratio.
- Compared to the rest of the industry, the Price/Free Cash Flow ratio of ACLS indicates a rather cheap valuation: ACLS is cheaper than 93.52% of the companies listed in the same industry.
- ACLS has an outstanding profitability rating, which may justify a higher PE ratio.
- ACLS's earnings are expected to grow with 24.02% in the coming years. This may justify a more expensive valuation.
Evaluating Profitability: ACLS
ChartMill utilizes a Profitability Rating to assess stocks, scoring them on a scale of 0 to 10. This rating takes into account a variety of profitability ratios and margins, both in absolute terms and in comparison to industry peers. ACLS has earned a 8 out of 10:
- ACLS has a Return On Assets of 14.90%. This is amongst the best in the industry. ACLS outperforms 86.11% of its industry peers.
- With an excellent Return On Equity value of 19.85%, ACLS belongs to the best of the industry, outperforming 85.19% of the companies in the same industry.
- ACLS's Return On Invested Capital of 16.22% is amongst the best of the industry. ACLS outperforms 90.74% of its industry peers.
- Measured over the past 3 years, the Average Return On Invested Capital for ACLS is significantly above the industry average of 11.60%.
- The 3 year average ROIC (21.34%) for ACLS is well above the current ROIC(16.22%). The reason for the recent decline needs to be investigated.
- ACLS has a better Profit Margin (19.75%) than 78.70% of its industry peers.
- ACLS's Profit Margin has improved in the last couple of years.
- ACLS has a Operating Margin of 20.71%. This is in the better half of the industry: ACLS outperforms 79.63% of its industry peers.
- In the last couple of years the Operating Margin of ACLS has grown nicely.
How do we evaluate the Health for ACLS?
Every stock is evaluated by ChartMill, receiving a Health Rating on a scale of 0 to 10. This assessment considers different health aspects, including liquidity and solvency, both in absolute terms and relative to industry peers. ACLS has achieved a 9 out of 10:
- ACLS has an Altman-Z score of 5.17. This indicates that ACLS is financially healthy and has little risk of bankruptcy at the moment.
- ACLS's Altman-Z score of 5.17 is fine compared to the rest of the industry. ACLS outperforms 64.81% of its industry peers.
- The Debt to FCF ratio of ACLS is 0.34, which is an excellent value as it means it would take ACLS, only 0.34 years of fcf income to pay off all of its debts.
- ACLS's Debt to FCF ratio of 0.34 is amongst the best of the industry. ACLS outperforms 83.33% of its industry peers.
- ACLS has a Debt/Equity ratio of 0.04. This is a healthy value indicating a solid balance between debt and equity.
- ACLS has a Current Ratio of 5.41. This indicates that ACLS is financially healthy and has no problem in meeting its short term obligations.
- ACLS's Current ratio of 5.41 is amongst the best of the industry. ACLS outperforms 80.56% of its industry peers.
- ACLS has a Quick Ratio of 4.05. This indicates that ACLS is financially healthy and has no problem in meeting its short term obligations.
- ACLS has a better Quick ratio (4.05) than 74.07% of its industry peers.
Growth Insights: ACLS
A key component of ChartMill's stock assessment is the Growth Rating, which spans from 0 to 10. This rating evaluates diverse growth factors, such as EPS and revenue growth, considering both past performance and future projections. ACLS has received a 5 out of 10:
- ACLS shows a strong growth in Earnings Per Share. Measured over the last years, the EPS has been growing by 64.54% yearly.
- Measured over the past years, ACLS shows a very strong growth in Revenue. The Revenue has been growing by 24.30% on average per year.
- Based on estimates for the next years, ACLS will show a very strong growth in Earnings Per Share. The EPS will grow by 24.02% on average per year.
Our Decent Value screener lists more Decent Value stocks and is updated daily.
Check the latest full fundamental report of ACLS for a complete fundamental analysis.
Keep in mind
Important Note: The content of this article is not intended as trading advice. It is essential to perform your own analysis and exercise caution when making trading decisions. The article presents observations created by automated analysis but does not guarantee any trading or investment outcomes. Always trade responsibly and make independent judgments.