
Investors looking for companies with both solid fundamental growth traits and positive technical patterns often use a two-part analysis method. This method joins fundamental analysis to find companies with good financial condition and increasing growth with technical analysis to find good entry points. The plan focuses on stocks set for possible price gains from strong business results while also displaying positive chart patterns that imply momentum could be forming. This combined method tries to get growth stocks at good technical points.
ACADIA PHARMACEUTICALS INC (NASDAQ:ACAD) offers a notable example for this investment method. The biopharmaceutical company works on creating and selling treatments for central nervous system disorders and rare diseases, with its sold products including NUPLAZID for Parkinson's disease psychosis and DAYBUE for Rett syndrome.
Fundamental Growth Strength
The company's fundamental picture shows several features that growth investors usually look for. According to the fundamental analysis report, ACADIA displays notable growth numbers that support review within a growth investing structure:
- Earnings Per Share has jumped by 150% over the past year
- Revenue has increased by 14.41% in the past year with a five-year average yearly growth rate of 23.08%
- Estimated EPS growth of 41.41% each year in coming years
- Revenue growth estimates of 10.77% each year going forward
These growth numbers are much higher than wider market averages and show the company's successful sales work and pipeline progress. For growth investors, this kind of speed in both past and expected financial measures points to a company possibly in a growth stage, which fits the main idea of growth investing, finding companies increasing quicker than their competitors and the general market.
Financial Condition and Profitability
Beyond just growth, the company keeps financial features that help lasting growth:
- Good profit margin of 21.80%, doing better than 95% of biotechnology industry companies
- Strong return on equity of 27.01%, placed in the top 3% of the industry
- No debt on the balance sheet, giving financial room
- Current ratio of 2.91 shows enough cash for operations
These condition and profitability measures are important for growth investors because they indicate the company can pay for its growth from inside while keeping financial steadiness. Companies with poor financial condition frequently have trouble maintaining growth during hard times or might need to reduce shareholder value through extra stock sales.
Technical Pattern and Market Place
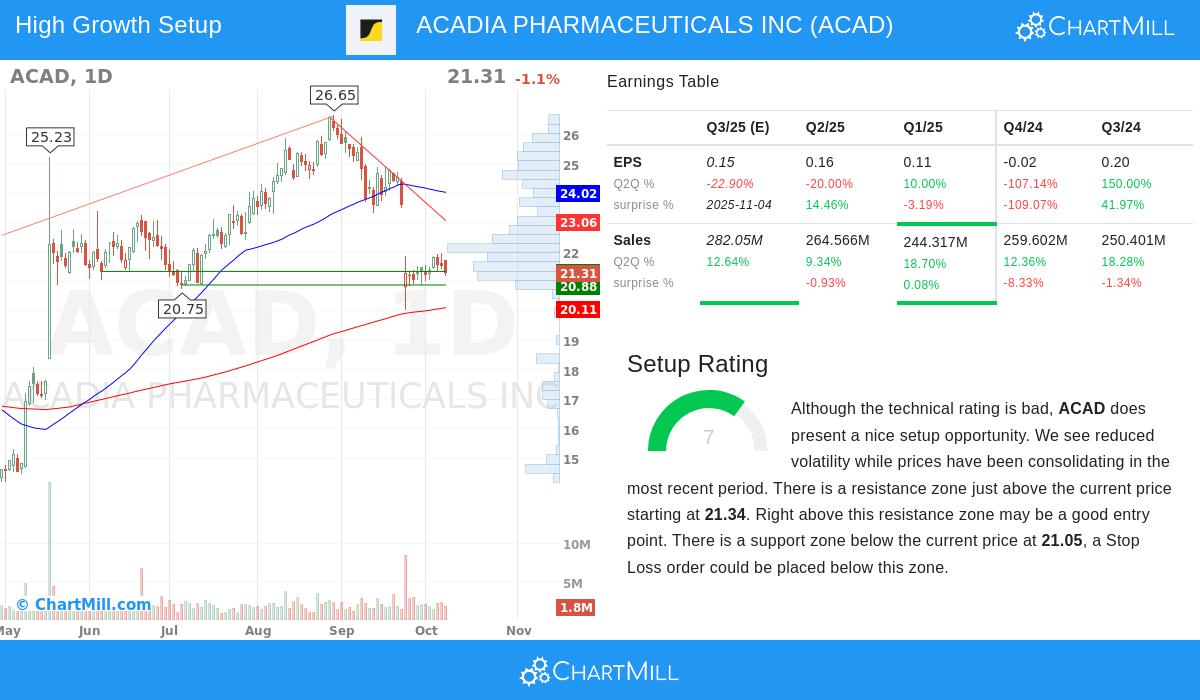
The technical analysis shows a stock now moving in a set range while displaying a good setup score of 7 out of 10. This technical shape often comes before possible breakout moves:
- The stock is priced between support near $21.05 and resistance about $21.34
- Lower volatility during recent movement suggests gathering force for a price move
- Long-term direction stays neutral while short-term direction shows some softness
- The stock has done much better than 81% of all stocks over the past year
For technical analysts, such movement patterns after strong performance can be continuation patterns where the stock builds strength before continuing its upward path. The nearness to resistance levels makes this a zone where breakout observers would usually watch for high-volume moves above set technical points.
Valuation Points
While growth stocks often have high valuations, ACADIA shows a varied picture:
- P/E ratio of 47.36 seems high next to the S&P 500 average of 27.91
- But, inside the biotechnology industry, the company is valued lower than 92% of peers
- Forward P/E of 24.64 matches more closely with market averages
- Strong earnings growth expectations could support current valuation levels
Growth investors often take higher valuations for companies showing solid growth, especially when that growth is thought to continue. The main point becomes if the growth path can maintain and finally support the current price.
Investment Setting and View
The company's focus on central nervous system disorders and rare diseases places it in specific treatment areas with large unmet medical needs. This market focus fits with key growth investing ideas, focusing on companies working in growing markets with lasting competitive edges. The advance of the company's pipeline, including extra uses for current products and new development candidates, gives several possible triggers for future growth.
For investors using the joined fundamental and technical method, ACADIA stands as a notable candidate that grades well on growth fundamentals while presenting a technical pattern that implies possible short-term momentum. The good growth scores together with the positive technical pattern make a situation where fundamental strength and technical place may come together.
Find other solid growth stocks with positive technical setups using our stock screener.
Disclaimer: This analysis is for information only and does not make up investment advice, suggestion, or support of any security. Investors should do their own research and talk with a financial advisor before making investment choices. Past results are not a sign of future results, and all investments have risk including possible loss of original money.