
In the effort to find stocks with the possibility for major price gains, many investors use organized methods that mix technical and fundamental study. One well-known method is the plan created by Mark Minervini, a two-time U.S. Investing Champion. His method, called the Specific Entry Point Analysis (SEPA), focuses on locating stocks in solid technical upward movements that also have improving fundamental growth. This double aim seeks to identify market leaders early in their large price moves while carefully controlling risk. A main instrument in this structure is the Minervini Trend Template, a group of technical rules made to sort for stocks showing strong, confirmed upward movements. When paired with filters for strong growth momentum, this method can identify choices that match the central ideas of momentum and growth investing.
A Solid Technical Base: The Trend Template Check
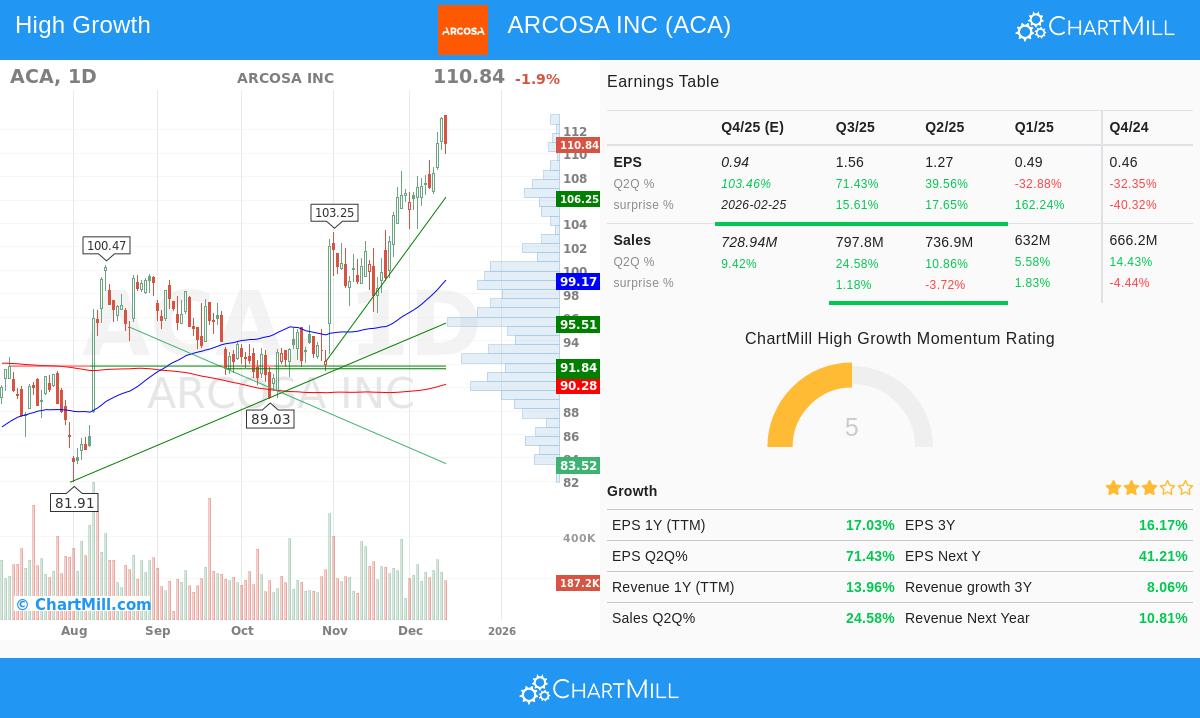
The first part of the Minervini plan is confirming a stock is in a verified, long-term upward movement, what he calls Stage 2. The Trend Template gives a clear list for this. A look at ARCOSA INC (NYSE:ACA) shows it now fits these important technical requirements:
- Trend Position: The stock's price is trading above all its main simple moving averages (SMAs), the 50-day ($99.17), 150-day ($93.78), and 200-day ($90.28). Also, these averages are in the correct bullish order: the 50-day SMA is above the 150-day, which is above the 200-day. This arrangement shows continued buying across different time periods.
- Nearness to Highs: ACA is trading within 2.1% of its 52-week high of $113.25, meeting the template's rule to be within 25% of the high. At the same time, at $110.84, it is over 60% above its 52-week low, well past the 30% minimum. This shows solid momentum and an absence of sellers from investors holding at higher prices.
- Relative Strength: With a ChartMill Relative Strength (CRS) score of 71.65, ACA is doing better than most of the wider market. Minervini notes that real market leaders usually have RS scores above 70, often in the 80s or 90s, as they pull the market higher instead of trailing it.
This technical view is supported by the wider market condition, where both the long and short-term movements for the S&P 500 are also good, giving a helpful setting for stocks in upward movements.
The Growth Driver: Strong Momentum Fundamentals
While a good chart is necessary, Minervini states that the largest gainers are always supported by strong fundamental growth. This is where the "High Growth Momentum" part of the filter works. ACA's recent financial numbers show several improvements that growth investors seek:
- Earnings Improvement: The latest quarter shows large year-over-year EPS growth of 71.4%, a big increase from the 39.6% growth in the quarter before. This sort of step-by-step gain in growth rate is a main sign of rising business momentum.
- Estimate Changes: Analysts are growing more positive about the company's future. The average EPS guess for the next fiscal year has been moved up by 5.7% over the last three months. Increasing guesses often come before institutional buying and more price gains.
- Revenue Growth: Sales growth stays firm, with last quarter's revenue rising by 24.6% year-over-year. Good sales increase gives a stable base for earnings growth and points to solid demand for the company's infrastructure-linked goods and services.
- Earnings Record: The company has a good recent history of beating guesses, exceeding EPS estimates in three of the last four quarters by an average of almost 39%.
These points show a company not only growing, but seeing its growth rate improve, a known trait of stocks that can start a time of major gains.
Combination: Why ACA Matches the Plan
The Minervini plan looks for joining: a technically good stock moving upward as its basic business fundamentals reach a turning point. ACA seems to give this joining. The stock has formed a solid Stage 2 rise, recently reaching a new 52-week high with all main moving averages pointing up, a sign of continued institutional buying. This technical good condition is not happening alone; it is matching with a quarter of greatly improved earnings growth and positive analyst changes.
For the growth-focused investor, this pairing is important. The Trend Template removes weak, falling stocks, requiring a focus on market good condition. The high-growth filters then make sure the chosen company has the fundamental "force" to possibly continue and support that price good condition. In short, the method looks for the moment when getting better fundamentals are being seen and acted on by the market, as shown by the price chart.
Technical Condition Summary
A look at ACA's own Technical Analysis Report gives a measured outline of its chart condition. The report gives ACA a good technical score of 8 out of 10, noting its positive long and short-term movements and recent 52-week high. The setup score is a 6, showing that while the movement is very good, the stock may be stretched in the immediate term after its recent move, hinting at a chance for a pause period that could give a clearer entry point. The report finds several clear support areas below the current price, which would be key for setting risk control levels, like a stop-loss, if a position is started.
Locating Like Chances
ACA was found through an organized filter that joins Minervini's strict Trend Template with rules for high growth momentum. For investors wanting to use this same careful method to find other possible choices, the ready-made filter is available to use. You can find more results and study the current market for similar high-growth, upward-moving stocks by using this screening link.
Disclaimer: This article is for information and learning only. It is not meant as investment guidance, a suggestion, or an offer to buy or sell any security. The study is based on present data and a specific method; past results do not show future outcomes. Always do your own full study, think about your money situation and risk comfort, and talk with a qualified financial advisor before making any investment choices.