The Graham Number for Value Investors | ChartMill Guide
The Graham Number for Value Investors: Intrinsic Value, Margin of Safety, and Screening in ChartMill
Introduction
Value investors are always searching for practical, reliable ways to estimate whether a stock is undervalued, fairly valued, or overvalued. One of the simplest tools for this purpose is the Graham Number, a conservative valuation formula created by Benjamin Graham, legendary value investor and mentor to Warren Buffett.
The Graham Number provides a quick estimate of intrinsic value based only on a company’s earnings and book value, making it especially attractive for defensive, long-term investors. It offers a fast, easy way to assess whether a stock may offer a margin of safety, one of Graham’s most important principles.
With the new Graham Number filter in ChartMill, you can now apply this classic value approach directly within the stock screener to identify potential opportunities in seconds.
What Is the Graham Number?
The Graham Number is a formula designed to determine the maximum fair price a value investor should pay for a stock. It combines two fundamental indicators:
-
Earnings per share (EPS)
-
Book value per share (BVPS)
Both metrics reflect core components of a company’s financial strength: profitability and asset value. Graham believed these two measures offered a sufficiently conservative foundation for valuation.
The Graham Number helps answer a simple question:
- Is the stock’s current price reasonable when compared to its earnings and book value?
Because of its simplicity, the Graham Number is still widely used by value investors today.
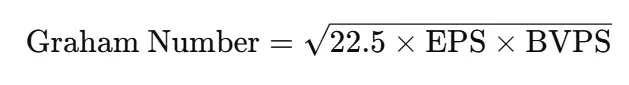
The Graham Number Formula Explained
The formula is:
Why 22.5?
Benjamin Graham recommended that defensive investors avoid stocks that exceed:
-
P/E ratio of 15
-
P/B ratio of 1.5
Multiplying these limits:

The Graham Number essentially says:
“A stock is fairly valued if its price does not exceed the level implied by both a reasonable P/E and a reasonable P/B.”
This makes it one of the most conservative intrinsic value formulas in value investing.
Understanding the 22.5 Constant
The constant 22.5 often raises questions among beginners. Here’s why Graham chose it:
-
It limits the price you’re willing to pay relative to earnings.
-
It limits the price you’re willing to pay relative to the company’s net assets.
-
It ensures you don’t overpay based on hype, growth assumptions, or short-term excitement.
In short, Graham wanted investors to pay a reasonable price for real business performance, not speculative potential. The 22.5 figure enforces this discipline.
How to Interpret the Graham Number
Once calculated, the Graham Number represents a fair value estimate. You can then compare it to the current stock price:
-
Price below the Graham Number → Potentially undervalued
-
Price near the Graham Number → Fairly valued
-
Price above the Graham Number → Potentially overvalued
Example
- EPS: $3.00
- BVPS: $20.00
Graham Number

If the stock trades at $30, it's about 18% below its Graham Number, a potentially undervalued opportunity.
This is precisely the type of setup value investors look for.
Advantages and Limitations of the Graham Number
Advantages for Value Investors
-
Simple and intuitive for beginners.
-
Based on real fundamentals, not forecasts.
-
Works well for stable, asset-heavy companies.
-
Ideal as a quick intrinsic value check.
-
Helps enforce a margin of safety in your buying decisions.
Key Limitations
Not suitable for:
-
high-growth stocks
-
young companies
-
businesses with mostly intangible assets
-
many modern tech companies
-
Uses past earnings, not forward projections.
-
Should not be used as a stand-alone buy/sell signal.
Despite these limitations, the Graham Number remains a powerful starting point for value-oriented screening.
How to Use the Graham Number in ChartMill
ChartMill now includes a dedicated Graham Number filter, allowing investors to quickly identify:
-
Undervalued stocks (price below Graham Number)
-
Fairly valued stocks (price near Graham Number)
-
Overvalued stocks (price above Graham Number)
This filter is available in the Fundamental Analysis section of the stock screener.
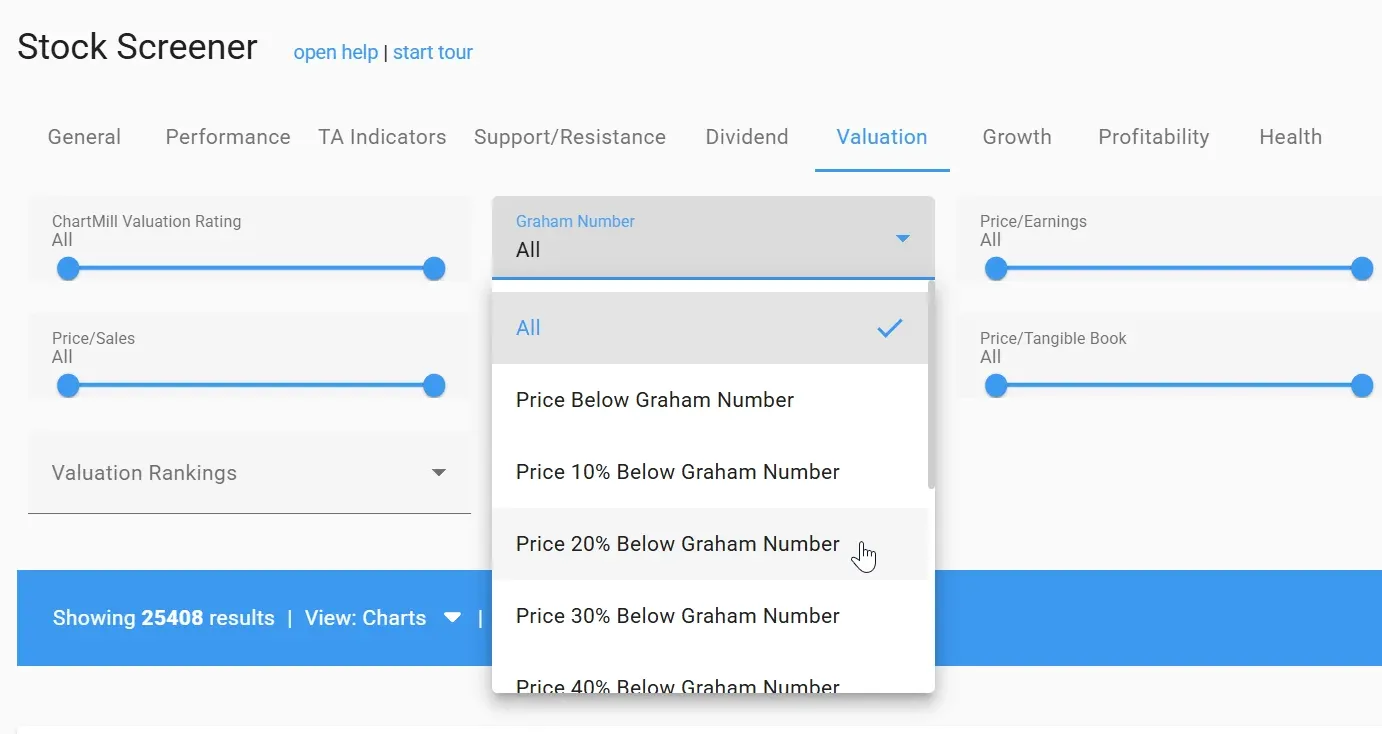
Screening Options in ChartMill
You can screen by how far the current price is above or below the Graham Number, such as:
-
Price at least 20% below Graham Number
-
Price at least 10% above Graham Number
This flexibility allows you to tailor screens to your investing philosophy, conservative, balanced, or aggressive.
Practical Value Investing Screens Using the Graham Number
Below are examples of screens you can build inside ChartMill.
A. Conservative Value Screen
Designed for classic Graham-style investing.
-
Price ≥ 20% below Graham Number
-
Positive EPS
-
Debt-to-Equity < 0.6
-
Current Ratio > 1.6
Direct link to this screen (US stocks only) (EU stocks only)
B. Quality Value Screen
Combines valuation with business quality.
-
Price below Graham Number
-
ROE > 10%
-
EPS growth last 3 years > 0%
Direct link to this screen (US stocks only) (EU stocks only)
C. Fair Value Candidates
Identify reasonably valued, stable companies.
-
Price within 10% of Graham Number (-10% > +10%)
-
'Stable EPS history' (EPS Growth 3Y >= 0%)
-
Dividend yield ≥ 2%
Direct link to this screen (US stocks only) (EU stocks only)
Note: “Stable EPS history” means the company has reported consistently positive earnings with no major year-to-year swings. A gradual upward trend is ideal, but the key point is that earnings are steady and predictable, not erratic. This aligns with Benjamin Graham’s preference for companies with reliable long-term performance.
These screens can be saved and reused inside ChartMill, forming part of a disciplined value investing workflow.
When the Graham Number Works - And When It Doesn’t
The Graham Number works best for:
-
industrial companies
-
financials
-
utilities
-
consumer staples
-
energy companies
-
businesses with consistent earnings
-
companies with tangible assets
It does not work well for:
-
technology firms
-
fast-growing companies
-
businesses with minimal tangible assets
-
companies with irregular or negative earnings
-
stocks with extremely high valuations
Understanding this context is crucial for avoiding false “undervalued” signals.
Frequently Asked Questions About the Graham Number
What is the Graham Number in stock valuation?
It is a simple formula to estimate a stock’s fair value using earnings per share and book value per share.
How do I find undervalued stocks using the Graham Number?
Use ChartMill’s Graham Number filter to screen for stocks trading below their Graham-based fair value.
Is the Graham Number still useful today?
Yes, for stable, asset-rich companies. It’s less reliable for tech and high-growth stocks.
Can I use the Graham Number for growth stocks?
Not recommended. Growth companies often have high P/E ratios, low book values, or negative earnings.
Is the Graham Number enough to make investment decisions?
No. It is a starting point. Always combine it with other fundamental and technical analysis.
Conclusion
The Graham Number is a timeless, conservative valuation tool that helps value investors estimate intrinsic value and identify stocks with a potential margin of safety. By combining earnings and book value into a single fair-value calculation, it provides a quick, disciplined way to assess whether a stock may be attractively priced.
With the new Graham Number filter in ChartMill, it’s now easier than ever to apply this classic method in real-world stock screening. Use it to discover undervalued opportunities, validate your investment ideas, and strengthen your value investing strategy.
The ChartMill Team