
For investors aiming to benefit from the momentum of companies with solid underlying business performance, a method that joins strong fundamental growth with encouraging technical patterns can be persuasive. This method tries to find stocks that are not only increasing their earnings and revenue faster than average but are also near a possible price breakout, as indicated by their chart patterns. The objective is to locate chances where improving company fundamentals might soon result in notable market price gains. One stock that recently appeared from this kind of screening process is Workday Inc. (NASDAQ:WDAY).
A Firm Growth Profile
Fundamentally, this method focuses on companies showing forceful and lasting growth, a main factor for long-term stock results. Workday’s fundamental report shows it meets this standard, receiving a firm Growth Rating of 7 out of 10. The company’s financials display a history of notable increase:
- Earnings Per Share (EPS) increased by 24.89% over the last year and has maintained an average yearly increase rate of 30.89% over recent years.
- Revenue rose by 13.16% in the last year and has been increasing at an average yearly rate of 18.42%.
This past performance is backed by forecasts for ongoing firmness. Analysts predict future yearly EPS increase of 17.80% and revenue increase of 12.58%. For a growth-centered method, these measures are vital as they indicate a company’s capacity to enlarge its operations and raise profitability over time, which is the central mechanism for shareholder value generation in growth investing.
Supporting Fundamentals: Profitability and Financial Condition
While growth is most important, it must be backed by good business operation. A company increasing quickly but losing cash or operating with poor efficiency holds greater risk. The screening process thus also assesses profitability and financial condition to confirm the growth is of good quality.
Workday’s Profitability Rating is at 6. The company has moved to steady profitability, with positive earnings and operating cash flow over the past year. Important margin numbers are especially firm:
- An Operating Margin of 15.55%, doing better than 82% of its software industry competitors.
- A Return on Invested Capital (ROIC) of 9.29%, which puts it in the leading group of its industry.
The company’s Financial Condition Rating is also a 6. Workday keeps a reasonable debt level, with a Debt-to-Equity ratio of 0.34, showing it is not too dependent on debt financing. Its Altman-Z score of 4.93 points to a low short-term risk of financial trouble. These elements supply a base that makes the company’s growth narrative more lasting and less exposed to economic changes.
The Technical Picture: Consolidation Before a Possible Move
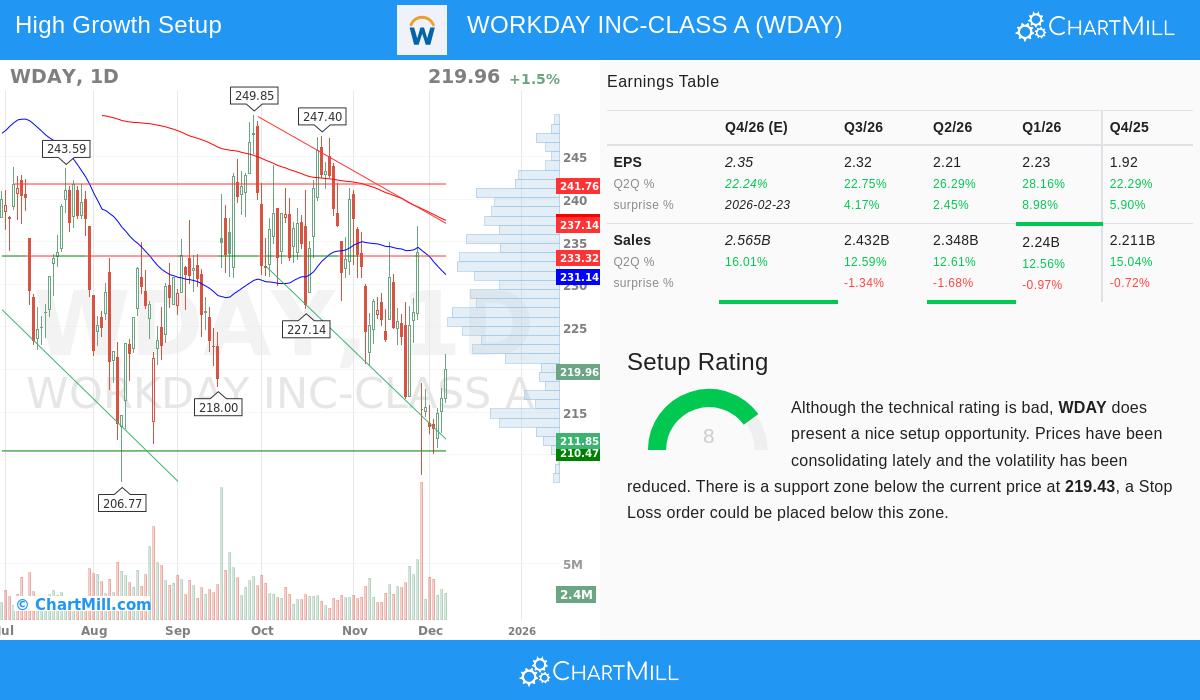
The second part of this method uses technical study to spot a positive entry point. The aim is to find stocks where the price movement indicates gathering momentum, frequently after a time of consolidation or pullback. According to Workday’s technical analysis report, the stock shows a notable picture with a Setup Rating of 8 out of 10, even with a low total technical rating caused by negative short and long-term trends.
The report states that WDAY has been trading in a broad range over the past month and is now consolidating in the middle of that range. Importantly, it spots a clear support zone below the present price, near the $219.43 level. This type of price activity, reduced volatility and consolidation close to support, can sometimes come before a new directional move. For a trader or investor using this joined method, this pattern indicates the stock may be forming a base from which it might try to move upward, particularly if the firm fundamental growth story starts to draw more market notice.
Valuation Setting
No study is whole without looking at price. Workday’s Valuation Rating is a neutral 5. While its Price-to-Earnings (P/E) ratio of 25.34 is high on an absolute basis, it is actually lower priced than 68% of its software industry competitors and trades similarly to the average S&P 500 P/E. More significantly, its low PEG ratio, which includes earnings growth, shows the stock may be fairly valued when its growth outlooks are considered. This middle ground is important for a growth-at-a-reasonable-price (GARP) method.
Conclusion
Workday Inc. shows the kind of chance a joined fundamental and technical screen aims to discover. The company displays the necessary quantitative standards for a growth stock: firm historical and forecasted growth in earnings and sales, backed by getting better profitability and sound financial condition. Technically, the stock is displaying indications of consolidation after a downward trend, presenting a specific risk level near support. This combination indicates that the negative price trend may be stopping, possibly creating the conditions for a change in direction that could be supported by its underlying business strength.
Interested in locating other stocks that fit this "Strong Growth with Good Technical Picture" profile? You can examine the full screening standards and see present outcomes by using this link to the stock screener.
,
Disclaimer: This article is for information only and does not form financial advice, a suggestion, or an offer or request to buy or sell any securities. The information shown is based on supplied data and should not be the only foundation for any investment choice. Investing includes risk, including the possible loss of principal. Always do your own research and think about talking with a qualified financial advisor before making any investment choices.