
Our stock screener has flagged TJX COMPANIES INC (NYSE:TJX) as a potential breakout candidate. This occurs when the stock shows signs of consolidation after a notable upward trend. While we can't predict the actual breakout, it's worth monitoring NYSE:TJX for potential movement.
Analyzing the Technical Aspects
As part of its analysis, ChartMill provides a comprehensive Technical Rating for each stock. This rating, ranging from 0 to 10, is updated on a daily basis and is based on the evaluation of various technical indicators and properties.
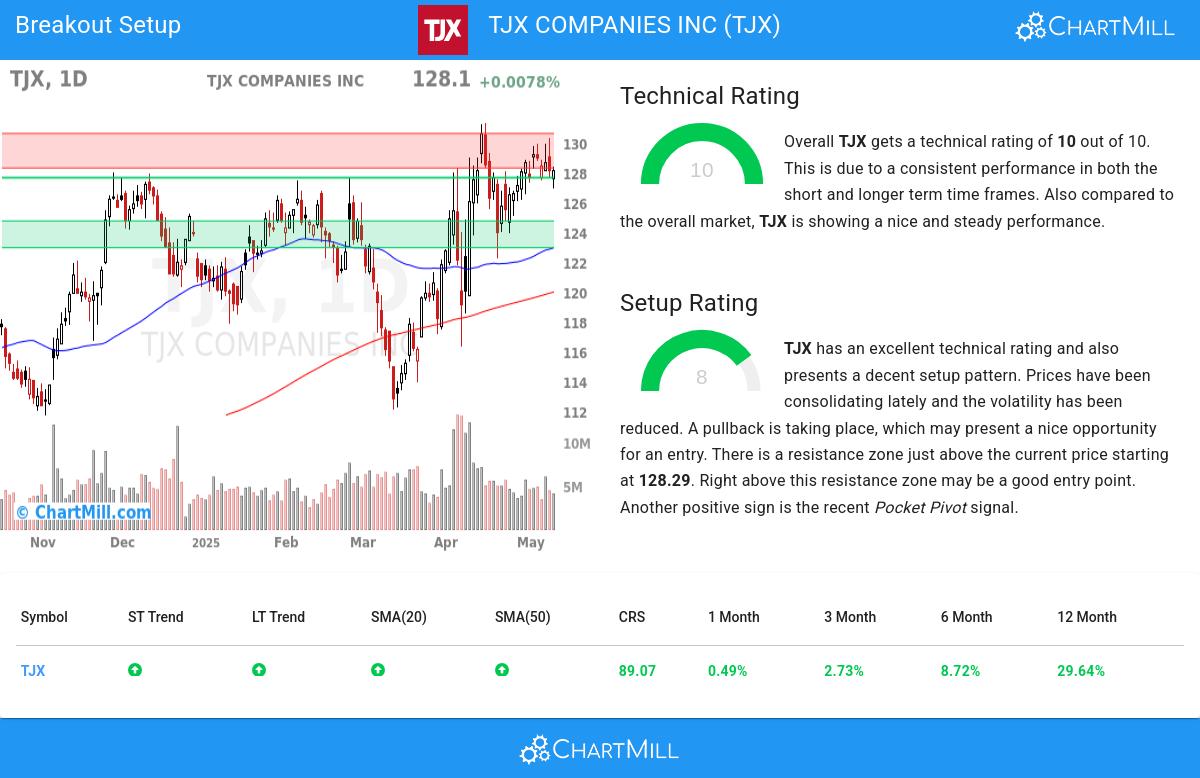
Overall TJX gets a technical rating of 10 out of 10. This is due to a consistent performance in both the short and longer term time frames. Also compared to the overall market, TJX is showing a nice and steady performance.
- Both the short term and long term trends are positive. This is a very positive sign.
- Looking at the yearly performance, TJX did better than 89% of all other stocks. On top of that, TJX also shows a nice and consistent pattern of rising prices.
- TJX is part of the Specialty Retail industry. There are 121 other stocks in this industry. TJX outperforms 86% of them.
- TJX is currently trading in the upper part of its 52 week range. The market is still in the middle of its 52 week range, so TJX slightly outperforms the market at the moment.
- In the last month TJX has a been trading in the 122.25 - 131.30 range, which is quite wide. It is currently trading in the middle of this range where prices have been consolidating recently, this may present a good entry opportunity, but some resistance may be present above.
Check the latest full technical report of TJX for a complete technical analysis.
How do we evaluate the setup for TJX?
Alongside the Technical Rating, ChartMill assigns a Setup Rating to evaluate the consolidation level of a stock. This rating, ranging from 0 to 10, is updated daily and considers various short-term technical indicators. The current setup rating for TJX is 8:
Besides having an excellent technical rating, TJX also presents a decent setup pattern. We see reduced volatility while prices have been consolidating in the most recent period. A pullback is taking place, which may present a nice opportunity for an entry. There is a resistance zone just above the current price starting at 128.29. Right above this resistance zone may be a good entry point. Very recently a Pocket Pivot signal was observed. This is another positive sign.
How can TJX be traded?
For a potential trade one would typically wait until the stock breaks out of the consolidation zone to enter the stock and it could be sold again for a loss when it would fall back below the zone.
Please note that this article should not be construed as trading advice. The information provided is solely based on automated technical analysis and serves to highlight technical observations. It is important to conduct your own analysis and make trading decisions based on your own judgment and responsibility.
Our Breakout screener lists more breakout setups and is updated daily.
Keep in mind
This is not investing advice! The article highlights some of the observations at the time of writing, but you should always make your own analysis and invest based on your own insights.