
For investors using technical analysis to find possible trades, the idea of a "breakout" is a fundamental method. The objective is to locate stocks that are in a solid, confirmed uptrend and are also resting in a consolidation, gathering force for their next upward move. By merging these two parts, a sound base of technical condition and a helpful price formation, traders try to start a position as the stock begins to move up again, presenting a good mix of risk and potential gain. A methodical way to locate these chances uses filters for stocks with strong scores for their extended trend force and the present state of their formation.
One stock presently seen on such filters is Royalty Pharma PLC-CL A (NASDAQ:RPRX). The company, which gives financing to the biopharmaceutical sector for future royalties on marketed products, displays an interesting technical picture that justifies more examination from investors focused on charts.
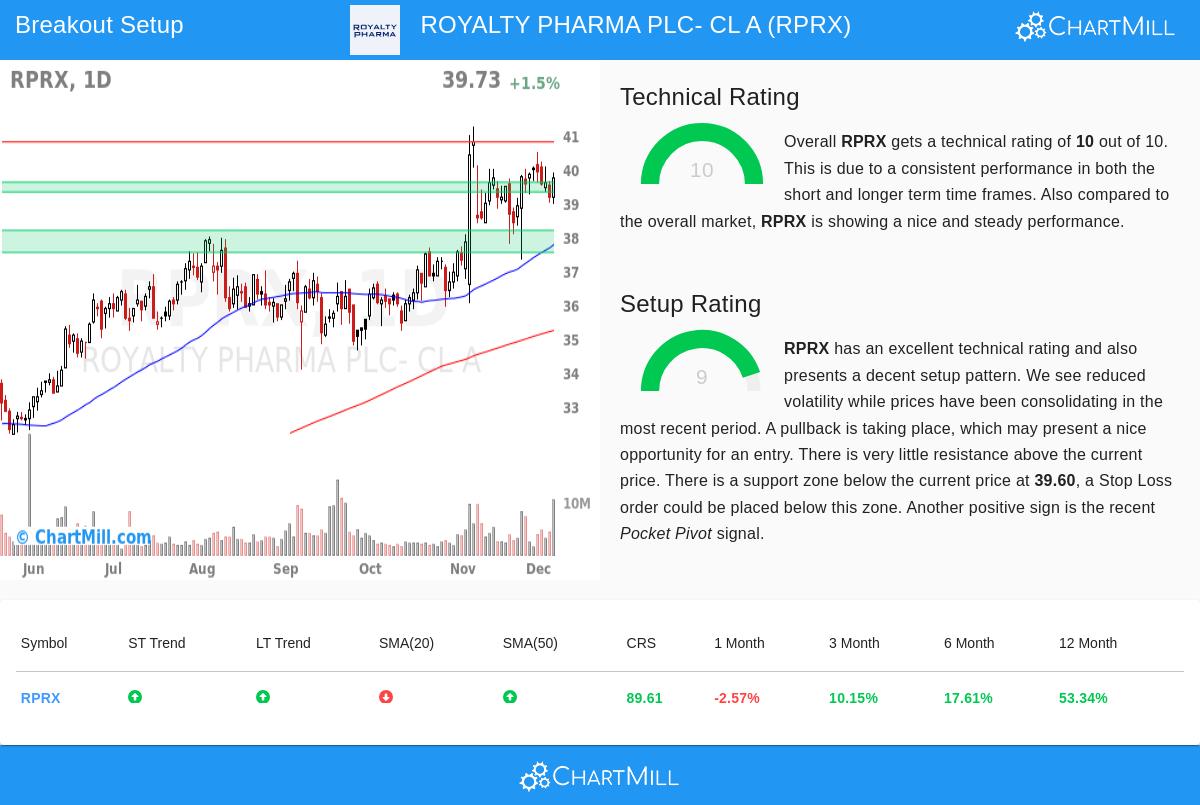
Reviewing the Technical Base
The first part of a breakout method is verifying the stock is in a lasting uptrend, not just a short-lived rise. The ChartMill Technical Report for RPRX gives the stock a full Technical Score of 10 out of 10, showing very good technical condition. This number comes from an analysis of multiple elements: trend, speed of change, and comparative results.
Important positives supporting this leading score are:
- Good Trend Agreement: The extended and near-term trends for RPRX are both positive. This agreement implies the upward movement is wide-ranging.
- Solid Comparative Results: The stock has done better than 89% of the whole market in the last year, a clear mark of strength. Also, it is doing better than 74% of other stocks in the Pharmaceuticals field.
- Helpful Average Prices: The stock's price is above its important average prices (20, 50, 100, and 200-day), which are all moving upward. This arrangement shows buyer interest at increasing price points.
A high Technical Score is key for the breakout approach because it selects for "market leaders." Starting a breakout in a stock that is already technically poor raises the chance of a misleading signal or a quick drop. RPRX’s score of 10 indicates it has the base condition to possibly continue a new rise.
Judging the Formation State
The second vital point is timing: even the soundest stock can be a bad purchase if it has moved too far and is ready for a decline. This is where the Formation State Score becomes important. It measures if the stock is making a clear consolidation shape, giving a defined area of stability and a sensible entry point. RPRX gets a strong Formation Score of 9.
The technical report points out several details adding to this positive formation review:
- Recent Consolidation: In the last month, RPRX has been moving in an area between about $37.31 and $40.50. It is now trading in the center of this area, showing a time of pause after its earlier increases.
- Clear Stability and Limit Points: The analysis finds a definite stability area between $39.31 and $39.60, made from a mix of average prices and trend lines. Just above, a horizontal limit point is seen near $40.79. This makes a well-marked trading area.
- Lowered Price Swings & Good Indicators: The report states that price swings have been lower during this consolidation, a common trait before a notable move. Also, a recent "Pocket Pivot" signal, a price build-up pattern with trading volume, was seen, adding a good detail to the formation.
For a breakout trader, this arrangement is very good. It gives a specific point to monitor for an entry, a move above the limit near $40.80, and a close, logical point to set a protective stop-loss order, below the stability area near $39.30, clearly setting the trade's possible loss.
A Possible Trade Plan
Bringing together these two strong scores, the technical report describes an example breakout plan. The proposed formation involves setting a buy-stop order at $40.80, waiting for the stock to clearly move past the noted limit point. A stop-loss order would be set at $39.30, just under the stability area, capping the possible loss on the trade to about 3.7%. This example shows how the high Technical and Formation Scores can become a clear, rule-guided trade idea with managed possible loss.
Find More Possible Breakout Formations The method that found RPRX can be used each day to find new chances. For investors wanting to see the present list of stocks showing good technicals and high-state formations, the results of the live Technical Breakout filter are viewable here.
Disclaimer: This article is for information only and is not investment guidance, a suggestion, or a bid to buy or sell any securities. The trade plan described is an automatic, example situation using technical measures and is not a promise of future results. Always do your own study, think about your money position and risk comfort, and talk to a registered financial advisor before making any investment choices. Past results do not show future outcomes.