
A screening method that uses both fundamental and technical analysis can help investors find companies with good core business measures while also finding good entry points based on price movement. This method looks for growth stocks that are not only financially sound and profitable but are also showing technical patterns that indicate a possible price rise. By concentrating on companies with increasing earnings, strong balance sheets, and positive chart patterns, this plan tries to find stocks ready for upward movement.
UNIVERSAL DISPLAY CORP (NASDAQ:OLED) researches, develops, and sells organic light emitting diode (OLED) technologies and materials for display and solid-state lighting applications. The company's own technologies serve a big and growing target market, including mobile phones, televisions, and automotive displays, which fits the qualitative condition for growth investing of working in a market with large potential.
Fundamental Strength Supports Growth Thesis
The company's fundamental profile, as detailed in its fundamental analysis report, shows a solid base that meets the main standards for a good growth stock. The screening method gives priority to companies with sound financial health and profitability to make sure they can maintain their growth path, and Universal Display Corp does well in these areas.
- Excellent Financial Health: The company gets a top ChartMill Financial Health Rating of 9 out of 10. This is backed by:
- No debt, putting it in the top of its industry for financial stability.
- A high Current Ratio of 8.05 and Quick Ratio of 6.39, showing good cash to cover short-term needs.
- Strong Profitability: The ChartMill Profitability Rating of 8 out of 10 points to good operations.
- A Profit Margin of 36.90% and an Operating Margin of 38.93% are better than over 95% of similar companies in the Semiconductors industry.
- Good returns are shown by a Return On Equity of 14.25% and a Return On Invested Capital of 11.73%.
- Increasing Growth: The company's Growth Rating of 7 out of 10 is supported by positive future outlooks, an important part for growth investing.
- Earnings Per Share (EPS) are expected to grow by 20.56% each year in the near future.
- Revenue growth is also predicted to increase to 17.10% per year.
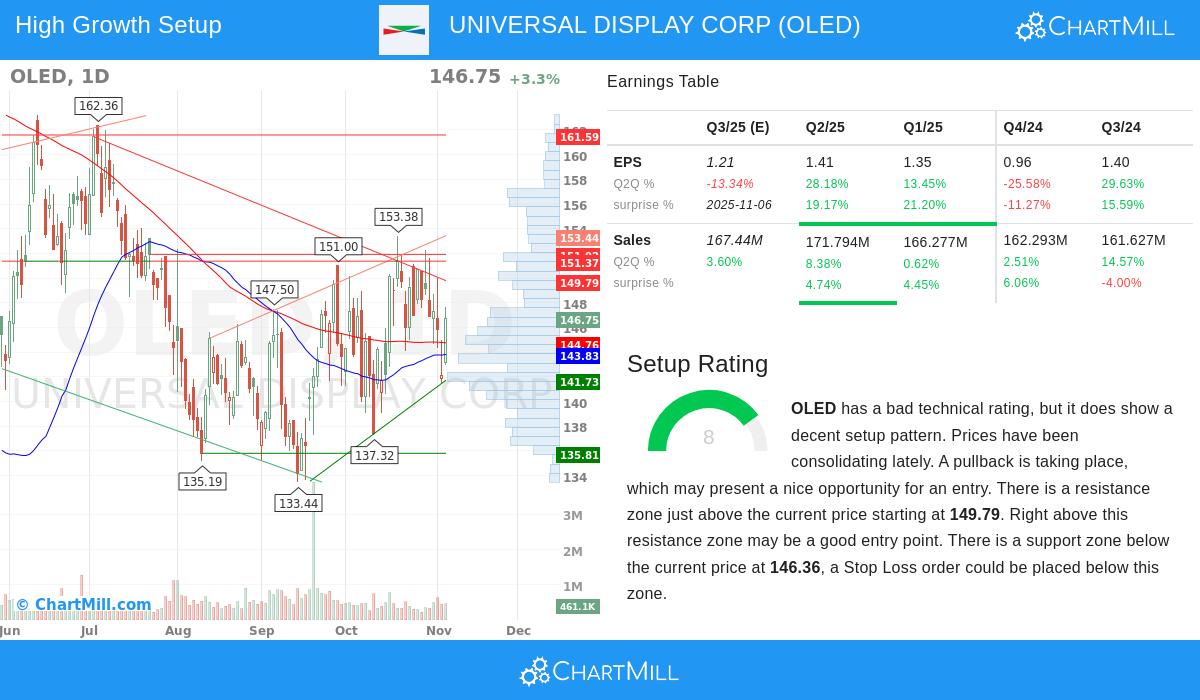
Technical Setup Indicates a Possible Price Rise
While the overall technical rating is neutral, the more detailed technical analysis report finds a positive setup for traders. The screen specifically searches for these patterns, as they can point to a coming move upward.
- Consolidation Period: The stock has been trading in a wide range between $137.32 and $153.38 over the last month and is currently consolidating in the middle of this range. These times of consolidation often come before a notable price change.
- Clear Support and Resistance: The chart shows a defined support area between $141.73 and $146.36, made by important moving averages and trendlines. A resistance area exists just above the current price, starting at $149.79.
- Positive Setup Rating: Despite the neutral trend, the stock gets a high ChartMill Setup Rating of 8 out of 10. This shows that the current price movement, with the stock moving back toward support within a consolidation range, could offer a possible entry chance for a move to the overhead resistance.
Connecting the Criteria to the Investment Thesis
The mix of these fundamental and technical factors is what gives this screening plan its strength. The good health and profitability ratings make sure the company is on stable ground, lowering the risk that comes with usual high-growth investments. The increasing earnings and revenue growth confirm the "growth" part of the plan. Finally, the technical setup gives a tactical entry point, letting investors place themselves in a fundamentally sound company as its price movement starts to indicate a return of upward momentum. This complete method tries to join the "what to buy" with the "when to buy."
For investors interested in finding other companies that match this profile of strong growth fundamentals combined with positive technical breakout patterns, more results can be found using the Strong Growth Stock Technical Setups screen.
Disclaimer: This article is for informational purposes only and does not constitute investment advice, a recommendation, or an offer or solicitation to buy or sell any securities. The information presented should not be used as the sole basis for making any investment decision. Always conduct your own due diligence and consult with a qualified financial advisor before making any investment.