
NETAPP INC (NASDAQ:NTAP) was identified as a stock worth exploring by dividend investors by our stock screener. NTAP scores well on profitability, solvency and liquidity. At the same time it seems to pay a decent dividend. We'll explore this a bit deeper below.
Assessing Dividend for NTAP
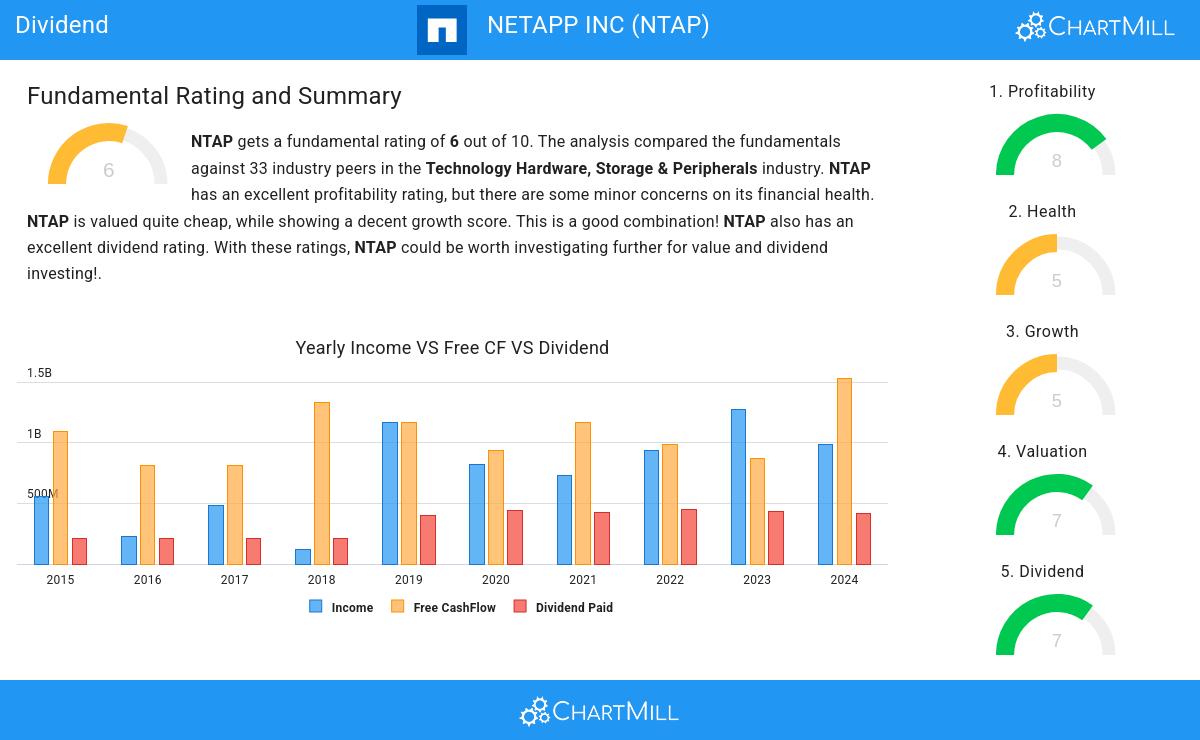
ChartMill assigns a Dividend Rating to every stock. This score ranges from 0 to 10 and evaluates the different dividend aspects, including the yield, the growth and sustainability. NTAP scores a 7 out of 10:
- NTAP's Dividend Yield is rather good when compared to the industry average which is at 3.29. NTAP pays more dividend than 81.82% of the companies in the same industry.
- NTAP has been paying a dividend for at least 10 years, so it has a reliable track record.
- NTAP has not decreased its dividend for at least 10 years, so it has a reliable track record of non decreasing dividend.
- NTAP pays out 37.20% of its income as dividend. This is a sustainable payout ratio.
- The dividend of NTAP is growing, but earnings are growing more, so the dividend growth is sustainable.
Assessing Health Metrics for NTAP
ChartMill employs a unique Health Rating system for all stocks. This rating, ranging from 0 to 10, is determined by analyzing various liquidity and solvency ratios. For NTAP, the assigned 5 for health provides valuable insights:
- NTAP has a better Altman-Z score (2.54) than 69.70% of its industry peers.
- NTAP has a debt to FCF ratio of 1.58. This is a very positive value and a sign of high solvency as it would only need 1.58 years to pay back of all of its debts.
- With an excellent Debt to FCF ratio value of 1.58, NTAP belongs to the best of the industry, outperforming 87.88% of the companies in the same industry.
- Although NTAP does not score too well on debt/equity it has very limited outstanding debt, which is well covered by the FCF. We will not put too much weight on the debt/equity number as it may be because of low equity, which could be a consequence of a share buyback program for instance. This needs to be investigated.
Profitability Insights: NTAP
ChartMill assigns a proprietary Profitability Rating to each stock. The score is computed by evaluating various profitability ratios and margins and ranges from 0 to 10. NTAP was assigned a score of 8 for profitability:
- Looking at the Return On Assets, with a value of 12.65%, NTAP belongs to the top of the industry, outperforming 87.88% of the companies in the same industry.
- NTAP has a Return On Equity of 114.27%. This is amongst the best in the industry. NTAP outperforms 96.97% of its industry peers.
- NTAP has a Return On Invested Capital of 22.77%. This is amongst the best in the industry. NTAP outperforms 87.88% of its industry peers.
- The 3 year average ROIC (15.62%) for NTAP is below the current ROIC(22.77%), indicating increased profibility in the last year.
- Looking at the Profit Margin, with a value of 17.47%, NTAP belongs to the top of the industry, outperforming 93.94% of the companies in the same industry.
- NTAP has a Operating Margin of 21.48%. This is amongst the best in the industry. NTAP outperforms 90.91% of its industry peers.
- NTAP has a Gross Margin of 70.62%. This is amongst the best in the industry. NTAP outperforms 100.00% of its industry peers.
- NTAP's Gross Margin has improved in the last couple of years.
Our Best Dividend screener lists more Best Dividend stocks and is updated daily.
Check the latest full fundamental report of NTAP for a complete fundamental analysis.
Keep in mind
This article should in no way be interpreted as advice. The article is based on the observed metrics at the time of writing, but you should always make your own analysis and trade or invest at your own responsibility.