
In equity investing, blending separate analytical methods can offer a better structure for finding opportunities. One method is to look for stocks that show good core business qualities while also having a positive price chart pattern. The plan centers on firms with clear growth, good earnings, and sound finances—signs of a lasting company—and then adds a chart study to find possible times to buy during phases of price stability or upward moves. This technique tries to match a company's quality story with the timing clues from its market price activity.
ALPHABET INC-CL A (NASDAQ:GOOGL), the parent of Google, recently appeared in a search made to locate such ideas. It is an interesting example of a leading, established firm that still shows the energetic expansion and operational quality common to a good growth stock, while its chart indicates a possible price pattern might be developing.
Fundamental Strength: The Engine for Growth
The main attraction of GOOGL is its strong fundamental picture, which gives the needed base for a growth investment. Based on its detailed fundamental analysis report, Alphabet gets a total score of 7 out of 10, with high marks in areas important for a growth investor.
- High Profitability and Financial Health: The company has very good scores for Profitability (9/10) and Financial Health (8/10). Its return on invested capital (ROIC) of 23.22% is much higher than its cost of capital, showing efficient value generation. With a low debt-to-equity ratio of 0.12 and an Altman-Z score showing no bankruptcy danger, Alphabet’s balance sheet is very strong. This financial steadiness is essential for a growth stock, as it lets the company spend on new projects without being weighed down by debt.
- Strong and Continued Growth: Alphabet’s Growth score is a good 7/10. The company has posted notable past growth, with earnings per share (EPS) increasing at an average yearly pace of 29% and revenue rising more than 17% per year in recent years. While future growth projections are seen to slow, they remain good, with analysts predicting average yearly EPS growth above 16%. This shows the company’s capacity to grow its large advertising business while also building new income sources in cloud computing and other areas.
- Fair Valuation Considering the Picture: With a Valuation score of 4/10, Alphabet is not typically "low-priced." Its P/E ratio is higher than both industry and wider market averages. However, this higher price can be accepted due to its high profitability and better-than-average growth outlook. The search method accepts that high-caliber growth often has a higher cost; the point is making sure the price is not extreme compared to the company’s growth path and quality, a balance GOOGL seems to maintain.
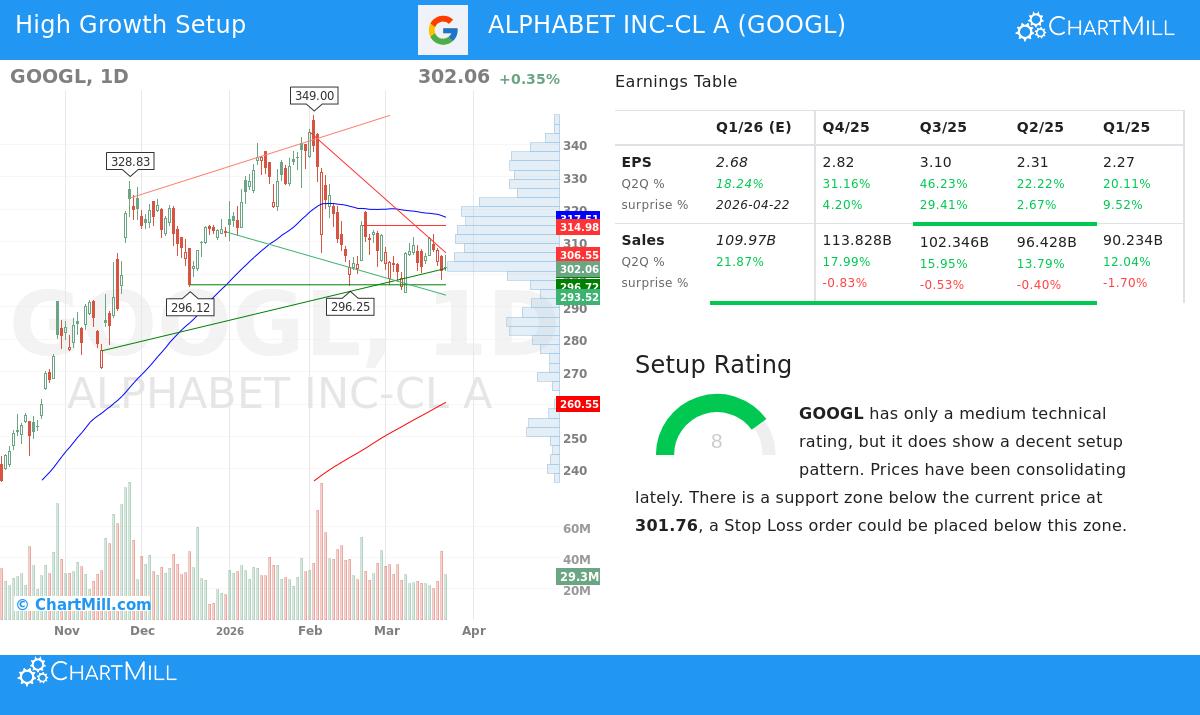
Technical Setup: Finding a Possible Turning Point
While fundamentals decide the what to buy, chart study can give hints on when. Alphabet’s technical analysis report shows a stock in a change period, getting a Setup Rating of 8 out of 10 even with an average total technical score.
- Stability Inside a Longer-Term Upward Path: The longer-term direction for GOOGL is still up, with the stock much higher than a year ago. However, the near-term direction has turned down as the price has moved lower from recent peaks. This has made a stability phase, with the stock moving between about $294 and $314 over the last month. Such times of sideways action after a good rise can often end with a return to the main direction.
- Important Support and Resistance Points: The chart study finds a clear and notable support area between $296.72 and $301.76, made by a mix of trendlines. This zone could act as a possible base for the stock. On the other side, close resistance sits near the $305-$307 range. A clear move above this resistance with high trading volume could mark the end of the near-term stability and the start of upward movement again.
- Good Performance Compared to Others: It is important that GOOGL has done better than 91% of all stocks over the past year and a like portion of its group in the Interactive Media & Services industry. This relative performance is a key chart trait of top growth stocks, even during wider market declines.
Why This Blend Is Important
The link between these fundamental and chart factors is the heart of the search plan. A good growth stock with excellent fundamentals might still struggle if bought during a long time of market dislike or chart tiredness. By looking for a chart pattern—like stability near support within a longer-term upward path—an investor tries to time their purchase to a moment when selling may be easing and the chance for a new rise is growing. For GOOGL, its top-tier business gives the "why," and its present chart formation gives a defined "where" for handling risk, with the support zone acting as a sensible place for a stop-loss order if the pattern does not work.
Finding More Ideas
Alphabet Inc. shows how a very large technology leader can still have the growth traits and chart position to merit notice from growth-focused investors. For those wanting to use this mixed fundamental and chart method to find other possible ideas, the search that found GOOGL is ready for more review.
Disclaimer: This article is for informational and educational purposes only and does not constitute a recommendation to buy, sell, or hold any security. The analysis presented is based on data and reports available at the time of writing. Investing in stocks involves risk, including the potential loss of principal. You should conduct your own research and consult with a qualified financial advisor before making any investment decisions.