
For investors looking for chances where a company's market price seems separate from its actual business condition, a systematic value investing method can be a useful structure. This method focuses on finding stocks that are selling for less than their true worth, frequently indicated by low valuation measures, while also showing good financial condition and earnings. The aim is to discover good companies that are currently unpopular or not noticed, offering a possible buffer for patient investors. One stock that recently came up through this type of filtering process is The Gap Inc (NYSE:GAP).
Examining the Valuation
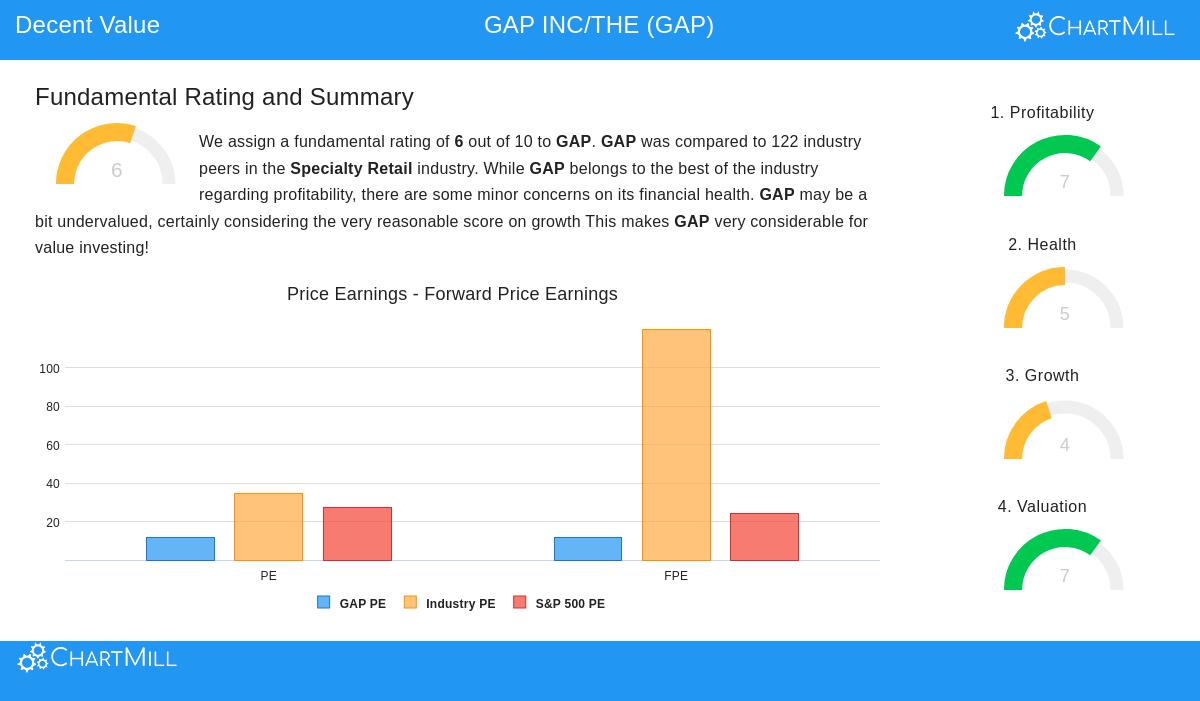
The foundation of any value investment argument is a good price, and this is where GAP is most notable. Based on ChartMill's fundamental analysis, the stock gets a Valuation Score of 7 out of 10, showing it is priced low compared to important financial measures. This score is not assigned casually, it comes from a numerical assessment against both its industry competitors and the wider market.
- Price-to-Earnings (P/E) Ratio: At 11.90, GAP's P/E ratio is much lower than the S&P 500 average of 27.33. More significantly, it is less expensive than about 82% of companies in the Specialty Retail industry.
- Forward P/E Ratio: The price narrative stays strong looking forward. With a forward P/E of 11.46, the stock is priced lower than over 82% of its industry competitors and notably under the S&P 500 forward average.
- Enterprise Value to EBITDA: This measure, which includes debt, also points to a low price. GAP is valued lower than almost 90% of its industry based on this calculation.
For a value investor, these numbers are the first filter. A low price offers the possible cushion that Benjamin Graham highlighted. It implies the market has assumed a lot of negative outlook, allowing space for a better re-evaluation if the company's basic condition stays sound or gets better.
Evaluating Financial Condition and Earnings
A low-priced stock is only a good investment if the company is financially stable and able to produce earnings. A low price on a struggling business is a mistake, not a value chance. This is why filtering for acceptable condition and earnings is vital together with price.
GAP receives a Condition Score of 5, pointing to a middling but steady financial state. The analysis shows a good Debt-to-Equity ratio of 0.41 and a solid Debt-to-Free-Cash-Flow ratio of 1.91, meaning the company could pay off all its debt with under two years of cash flow. While there are comments on a higher share count and a quick ratio that needs watching, the overall stability view does not show big warnings, which is important for a company operating in the competitive retail environment.
Where GAP does well is in its Earnings Score of 7. Even with recent difficulties, the company's ability to turn sales into profit is good compared to its sector.
- Its Return on Equity (ROE) of 23.33% and Return on Invested Capital (ROIC) of 10.37% both do better than more than three-quarters of industry competitors.
- Margins are a specific positive, with both Operating Margin (7.50%) and Profit Margin (5.57%) placed in the top group of the Specialty Retail industry.
This earnings ability is central to the value argument. It shows that the business model is still working and that the company keeps pricing ability and operational effectiveness. A profitable company trading at a low multiple is basically not the same as an unprofitable one doing so.
Growth Path and Dividend
Classic value stocks can sometimes miss growth, but the best candidate shows signals of a possible recovery or steady increase. GAP's Growth Score is a neutral 4, showing its position as an established retailer instead of a fast grower. Recent years have seen mostly unchanged revenue. However, the report notes a quickening pattern: future estimates for both Earnings Per Share and Revenue growth are positive and expected to be above the past five-year averages. This shift from small decrease to slight growth is an important point for investors, as it hints the company's strategic work may be beginning to show effect.
Also, GAP provides a dividend yield of 2.32%, which is above both its industry and the S&P 500 averages. The payout ratio is a manageable 28% of earnings. For value investors, a steady dividend can offer income while waiting for the market to adjust the stock price, and it often shows management's belief in the company's continuing cash flow.
Final Points: A Value Case in Retail
The Gap Inc presents a situation that matches main value investing ideas. It is a company with clear earnings and acceptable financial condition that is being valued by the market at a large reduction to both the wider market and its own industry. The mix of a good Valuation Score (7), a firm Earnings Score (7), and adequate Condition (5) and Growth (4) scores suggests it is not a failing business but possibly a missed one. While the retail sector deals with constant tests, the measures indicate GAP is producing real profit and cash flow, which are not being completely acknowledged in its present stock price.
For investors using a systematic value method, this outline deserves more study. The stock seems to offer the necessary parts: a price that gives a buffer, paired with the basic strength to imply that buffer may not be required forever.
Interested in reviewing other stocks that match this "Acceptable Value" outline? You can use the same filter applied to find GAP and find more possible chances here.
Disclaimer: This article is for information only and does not make up financial guidance, a suggestion, or an offer or request to buy or sell any securities. The analysis uses data supplied by ChartMill, and investors should do their own research and talk with a qualified financial advisor before making any investment choices. Past results do not show future outcomes.