
Uncover the hidden value in FEDERATED HERMES INC (NYSE:FHI) as our stock screening tool recommends it as an undervalued choice. FHI maintains a robust financial position and offers an attractive pricing perspective. Let's dig deeper into the analysis.
Unpacking FHI's Valuation Rating
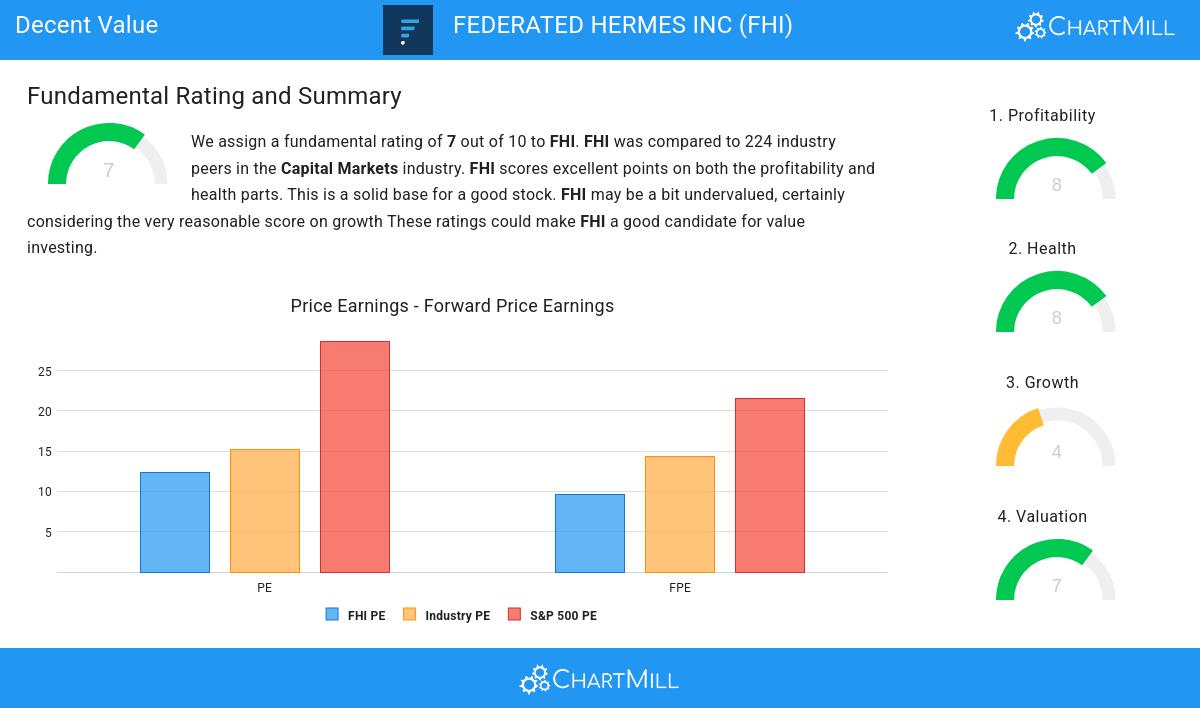
To assess a stock's valuation, ChartMill utilizes a Valuation Rating on a scale of 0 to 10. This comprehensive assessment considers various valuation aspects, comparing price to earnings and cash flows, while factoring in profitability and growth. FHI has achieved a 7 out of 10:
- Compared to an average S&P500 Price/Earnings ratio of 28.67, FHI is valued rather cheaply.
- FHI is valuated reasonably with a Price/Forward Earnings ratio of 9.61.
- FHI's Price/Forward Earnings ratio is a bit cheaper when compared to the industry. FHI is cheaper than 67.41% of the companies in the same industry.
- FHI's Price/Forward Earnings ratio indicates a rather cheap valuation when compared to the S&P500 average which is at 21.59.
- Compared to the rest of the industry, the Enterprise Value to EBITDA ratio of FHI indicates a rather cheap valuation: FHI is cheaper than 93.30% of the companies listed in the same industry.
- Compared to the rest of the industry, the Price/Free Cash Flow ratio of FHI indicates a somewhat cheap valuation: FHI is cheaper than 74.11% of the companies listed in the same industry.
- The low PEG Ratio(NY), which compensates the Price/Earnings for growth, indicates a rather cheap valuation of the company.
- FHI has an outstanding profitability rating, which may justify a higher PE ratio.
Profitability Assessment of FHI
ChartMill's Profitability Rating offers a unique perspective on stock analysis, providing scores from 0 to 10. These ratings consider a wide range of profitability metrics and margins, both in comparison to industry peers and on their own merits. For FHI, the assigned 8 is a significant indicator of profitability:
- FHI has a Return On Assets of 15.86%. This is amongst the best in the industry. FHI outperforms 96.88% of its industry peers.
- FHI's Return On Equity of 30.19% is amongst the best of the industry. FHI outperforms 95.54% of its industry peers.
- The Return On Invested Capital of FHI (21.30%) is better than 98.21% of its industry peers.
- The Average Return On Invested Capital over the past 3 years for FHI is significantly above the industry average of 6.99%.
- The 3 year average ROIC (16.23%) for FHI is below the current ROIC(21.30%), indicating increased profibility in the last year.
- FHI's Gross Margin of 95.24% is amongst the best of the industry. FHI outperforms 95.09% of its industry peers.
Unpacking FHI's Health Rating
Every stock is evaluated by ChartMill, receiving a Health Rating on a scale of 0 to 10. This assessment considers different health aspects, including liquidity and solvency, both in absolute terms and relative to industry peers. FHI has achieved a 8 out of 10:
- An Altman-Z score of 4.88 indicates that FHI is not in any danger for bankruptcy at the moment.
- FHI has a better Altman-Z score (4.88) than 87.05% of its industry peers.
- The Debt to FCF ratio of FHI is 1.02, which is an excellent value as it means it would take FHI, only 1.02 years of fcf income to pay off all of its debts.
- FHI has a Debt to FCF ratio of 1.02. This is amongst the best in the industry. FHI outperforms 87.05% of its industry peers.
- FHI has a Debt/Equity ratio of 0.32. This is a healthy value indicating a solid balance between debt and equity.
- With a decent Debt to Equity ratio value of 0.32, FHI is doing good in the industry, outperforming 75.45% of the companies in the same industry.
- A Current Ratio of 2.70 indicates that FHI has no problem at all paying its short term obligations.
- With a decent Current ratio value of 2.70, FHI is doing good in the industry, outperforming 78.13% of the companies in the same industry.
- FHI has a Quick Ratio of 2.70. This indicates that FHI is financially healthy and has no problem in meeting its short term obligations.
- FHI has a Quick ratio of 2.70. This is in the better half of the industry: FHI outperforms 78.57% of its industry peers.
How We Gauge Growth for FHI
ChartMill assigns a Growth Rating to each stock, ranging from 0 to 10. This rating is determined by analyzing different growth elements, including EPS and revenue growth, spanning both historical and future figures. In the case of FHI, the assigned 4 reflects its growth potential:
- The Earnings Per Share is expected to grow by 9.88% on average over the next years. This is quite good.
- When comparing the EPS growth rate of the last years to the growth rate of the upcoming years, we see that the growth is accelerating.
Every day, new Decent Value stocks can be found on ChartMill in our Decent Value screener.
Our latest full fundamental report of FHI contains the most current fundamental analsysis.
Keep in mind
This is not investing advice! The article highlights some of the observations at the time of writing, but you should always make your own analysis and invest based on your own insights.