
For technical investors, finding stocks that are in a solid uptrend and ready for their next move is a central task. One way to do this is by looking for stocks with both a high technical health score and a high setup quality score. This process, explained in ChartMill's method, first finds stocks in good technical uptrends and then selects those trading in a narrow area, hinting a breakout could be close. This pairing tries to locate chances where upward movement may continue from a clear starting level.
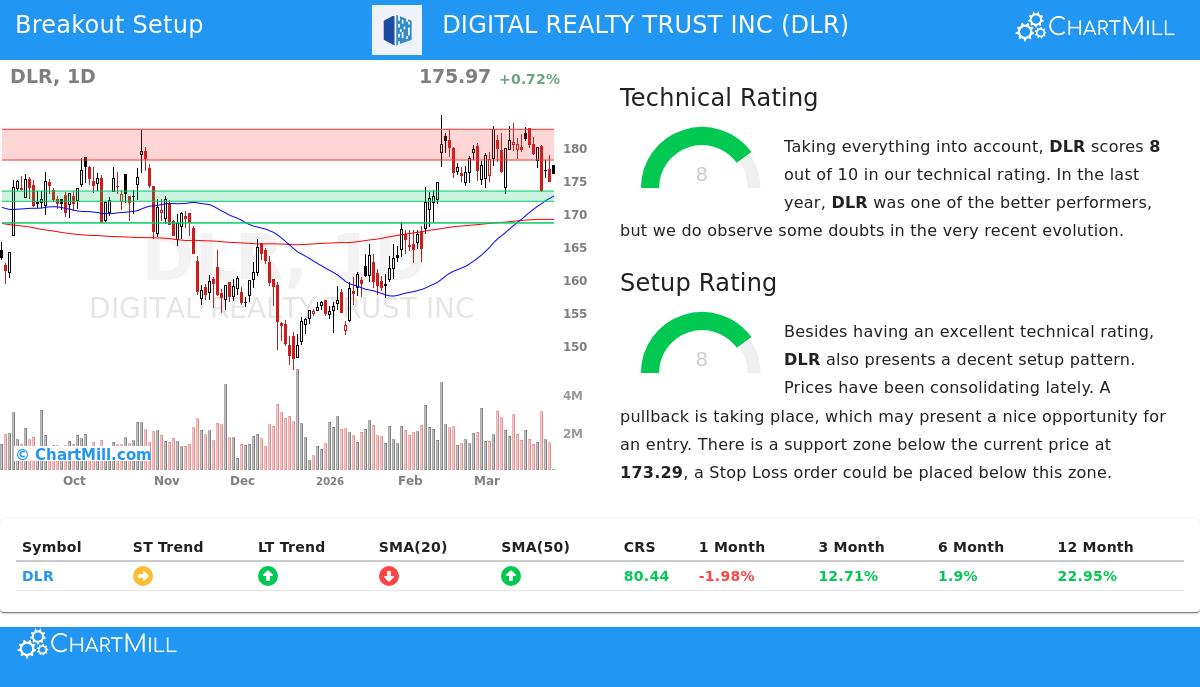
Digital Realty Trust Inc (NYSE:DLR), a major company in data center real estate, now shows a pattern matching this breakout screening method. The stock's technical report shows a double score of 8 out of 10 for both its Technical Rating and its Setup Quality, making it notable for investors using this focused method.
Looking at the Technical Base
The first part of the method is a solid technical rating, which verifies the stock's basic condition and trend path. A high score here is important since it distinguishes stocks in lasting uptrends from those only having a temporary rise or moving without direction. The detailed technical analysis report shows DLR has multiple traits of a stock with good technicals:
- Solid Long-Term Trend: The report gives a "positive" long-term trend score. This is the foundation of a high technical score, showing the stock's main path is up.
- Better Relative Performance: DLR's performance over one year is better than 80% of all stocks ChartMill tracks. More notably, it does better than 85% of similar companies in the Specialized REITs field, showing it leads its sector.
- Good Price Location: The stock is priced in the higher part of its 52-week span, similar to the wider S&P 500. This location is common for market leaders and agrees with the positive trend view.
- Helpful Moving Averages: Important moving averages like the SMA50 and SMA100 are seen as increasing, giving active support below the price and strengthening the upward pattern.
This overall technical view supports the strong rating of 8. For the breakout method, this means the stock has already shown it can draw buyers and keep an upward path, giving a good setting for any new breakout move.
Judging the Setup Quality
A solid trend by itself is not a buy signal; buying at a stretched point can cause quick declines. This is why the Setup Quality rating is key. It addresses the "when" by finding times of sideways movement or resting, which frequently come before the next continued price action. DLR's setup score of 8 implies it is in such a period.
- Recent Sideways Movement: The technical report states that in the last month, DLR has been trading between about $172.91 and $183.52. It is now trading in the center of this span, which the report sees as a consolidation that "may offer a good entry chance."
- Specific Support and Resistance: The analysis points out a clear support area between $171.74 and $173.29, made from a mix of trend lines and moving averages. A defined resistance area exists between $177.98 and $182.63. This makes a clear trading span.
- Specific Risk Limits: The existence of a firm support area below the present price allows for the sensible setting of a stop-loss order, an important part of managing risk in any breakout trade. The automatic analysis indicates a possible exit point just under $173.07.
The high setup score shows the stock is not stretched but is instead moving within a span. For a breakout trader, this setup gives a clear level to monitor—a clear move above the noted resistance area could mark the start of the next upward push, with a nearby support level giving a logical point to manage possible loss.
A Possible Trade Plan
Based on the combination of these scores, the technical report describes an example trade setup. It indicates a possible entry on a buy-stop order above the 10-day moving average near $178.56, with a stop-loss set below the recent span near $173.07. This would mean a risk of about 3.1% on the trade itself. It is very important to know this is an example created from the technical patterns, not advice. Investors must always do their own study, thinking about items like total market state—now negative for the S&P 500—and company-specific news before making any trade.
The method that found DLR can be used each day to find new possible chances. For investors wanting to see the present list of stocks showing good technicals and high-quality setups, the Technical Breakout Setups screen is refreshed often.
Disclaimer: This article is for information only and is not investment advice, a suggestion, or an offer or request to buy or sell any securities. The study uses technical data and automatic scoring models. All investing has risk, including the chance of losing the original investment. Past results do not guarantee future outcomes. Readers should do their own research and talk to a qualified financial advisor before making any investment choices.