
For investors who use technical analysis to find possible trades, a methodical process can help sort the market's distractions. One approach looks for stocks that show both good basic technical condition and a distinct, useful price formation. This tactic centers on two specific scores from ChartMill: the Technical Rating, which measures a stock's trend force and speed, and the Setup Quality Rating, which judges the merit of its present tightening formation. The aim is to locate stocks with good technicals that are tightening, possibly ready for a clear breakout move. A recent filter using this process has identified CoreCivic Inc (NYSE:CXW) as a candidate deserving more attention.
Technical Strength: A Good Base
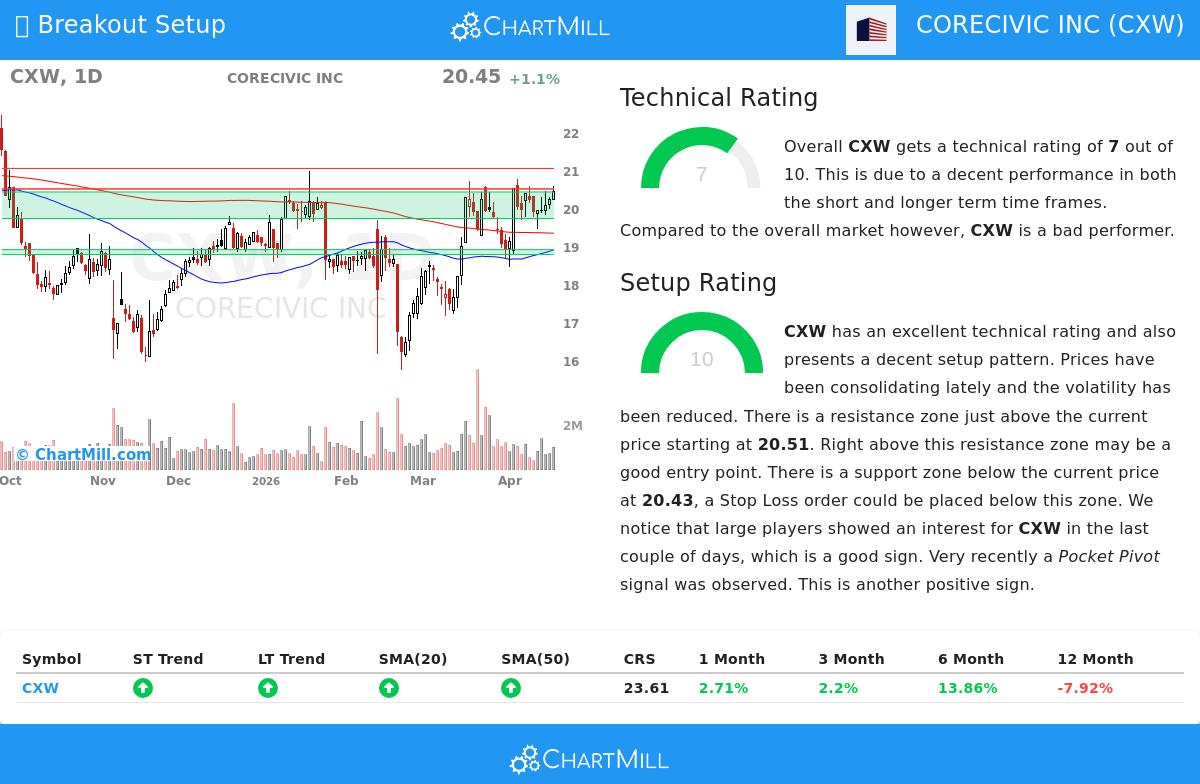
The first part of this tactic is a high Technical Rating, which confirms the stock is in a good trend instead of just moving up in a decline. Based on the latest technical report, CoreCivic receives a Technical Rating of 7 out of 10. This number indicates a good technical base, supported by several main points:
- Positive Trend Agreement: Both the near-term and longer-term trends for CXW are scored as positive. This agreement across periods is a strong positive sign, pointing to continued buying interest.
- Positive Average Structure: The stock's price is above its important near-term averages (20-day and 50-day SMAs), which are themselves in rising arrangements. This structure frequently acts as moving support during dips.
- Industry Comparison: While the report states CXW is behind the wider S&P 500, it is a typical performer inside its Commercial Services & Supplies industry, doing better than 62% of similar companies. This shows the stock's speed is not happening alone but is helped by sector factors.
A score of 7 puts CXW clearly in the "uptrend" group, meeting the important first filter for a breakout candidate by verifying the stock's basic technical condition is good.
Setup Quality: The Tightening Before the Move
A strong trend by itself is not a signal to buy; entering at a bad moment can lead to quick losses. This is where the Setup Quality Rating is key. It finds times of tightening or narrow trading ranges inside an uptrend, providing a more specific entry point with clear risk. CoreCivic does very well here, getting a top Setup Rating of 10.
The technical report explains why the setup is viewed as very good:
- Tightening Formation: The stock is shown as having a "good setup formation" with "lower movement while prices have been tightening in the latest period." This coiling action often comes before a big price move.
- Specific Formation Identification: The analysis states CXW "is now displaying a bull flag formation." This is a standard continuation formation where a fast price increase is followed by a small, downward-sloping tightening, usually ending with a breakout upward.
- Large Trader Activity: The report highlights positive action from big participants, as shown by the Effective Volume measure, and a recent "Pocket Pivot" sign. These are often seen as indicators of buying by knowledgeable investors.
A Clear Trading Plan
The mix of a good technical trend and a high-quality setup allows for outlining a specific, rule-based trading plan. The automatic analysis indicates a possible breakout above a set resistance area.
- Entry: A Buy Stop order could be set at $20.52, just above the closest resistance at $20.51.
- Exit (Stop Loss): A protective stop loss could be placed at $19.72, set below a main support area that goes from $19.73 to $20.43.
- Risk Control: This setup establishes a maximum risk of $0.80 per share, or about 3.9% from the entry price.
This distinct structure changes a general observation into a numerical plan, highlighting the need for set entry and exit points for controlling risk.
Finding Other Candidates
CoreCivic Inc shows the kind of candidate this technical filtering process is made to find: a stock with verified trend force that is now forming into a known pattern. For investors wanting to see a new list of similar technical breakout candidates, the filter is updated each day. You can see the newest outcomes by going to the Technical Breakout Setups filter on ChartMill.
Disclaimer: This article is for information only and is not investment guidance, a suggestion, or an offer to buy or sell any security. The trading plan described is created automatically and is for example. Always do your own research, think about your personal risk comfort, and talk with a qualified financial advisor before making any investment choices. Past results do not guarantee future outcomes.