
Technical breakout strategies focus on identifying stocks with solid momentum that are pausing before their next upward move. The method uses two main indicators: the ChartMill Technical Rating, which measures a stock’s trend strength, and the Setup Quality Rating, which checks if the stock is forming a reliable consolidation pattern. Stocks with high scores in both areas often offer good risk-reward potential, as they show strong technical signals and clear entry points.
CME GROUP INC (NASDAQ:CME) is a standout example under this approach. The company, a top derivatives marketplace, has shown steady technical performance and is now displaying a setup that could lead to a breakout.
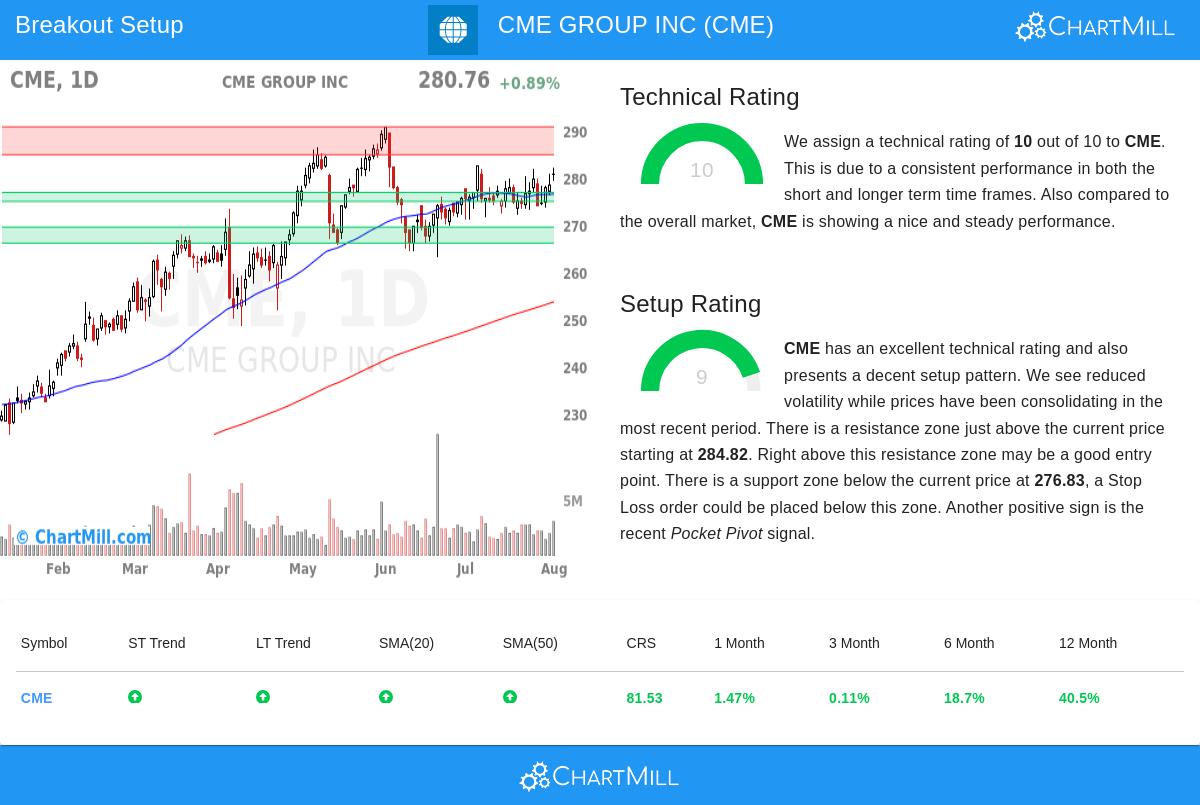
Technical Strength: A Perfect 10 Rating
The ChartMill Technical Rating for CME is a full 10 out of 10, reflecting strong trend health across all timeframes. Key reasons for this score include:
- Positive Trend Alignment: Both short-term and long-term trends are upward, supporting the stock’s rise.
- Market Leadership: CME is beating 81% of all stocks over the past year and ranks above 72% of its peers in the Capital Markets sector.
- Moving Average Support: The stock is above all major moving averages (20-day, 50-day, 100-day, and 200-day), with each average rising—a sign of ongoing bullish momentum.
- Strong Liquidity: With an average daily volume of 2.42 million shares, CME provides good liquidity, lowering slippage risks for traders.
This strong technical foundation indicates CME is a market leader with a high chance of continued growth, making it a good choice for trend-based strategies.
Setup Quality: A Clear Consolidation with Defined Levels
While technical strength is important, a good setup ensures clear entry and exit points. CME’s Setup Rating of 9 highlights a consolidation phase that may lead to another upward move. Key details include:
- Narrow Trading Range: Over the past month, CME has moved between $271.56 and $282.57, showing reduced volatility and forming a base.
- Support and Resistance Areas:
- Support is between $274.93 and $276.83, backed by trendlines and moving averages.
- Resistance is between $284.82 and $290.72, marking the next potential breakout level.
- Pocket Pivot Signal: Recent price action shows buying interest, with volume confirming the move—a positive sign for continued growth.
The setup suggests a breakout above $282.07 (the 10-day high) could lead to further gains, while a stop-loss below $274.92 (just below support) limits downside risk to 2.53%.
Why This Fits the Breakout Strategy
The mix of a perfect Technical Rating (10) and a high Setup Rating (9) matches the key ideas of breakout trading:
- Strong trends improve the chance of continued movement after a breakout.
- Tight consolidations lower risk by offering clear support and resistance levels.
- Volume-backed moves (like the Pocket Pivot) add confirmation.
For a closer look at CME’s technicals, see the full Technical Analysis Report.
Find More Breakout Opportunities
CME is one of many stocks showing strong breakout signals. To see other high-quality setups, visit the Technical Breakout Setups Screen for daily updates on the best technical opportunities in the market.
Disclaimer: This analysis is for informational purposes only and should not be seen as investment advice. Always do your own research and manage risk before trading.