
ISHARES SEMICONDUCTOR ETF (SOXX) Stock Price & Overview
NASDAQ:SOXX • US4642875235
Current stock price
465.75 USD
+4.31 (+0.93%)
At close:
465.5 USD
-0.25 (-0.05%)
After Hours:
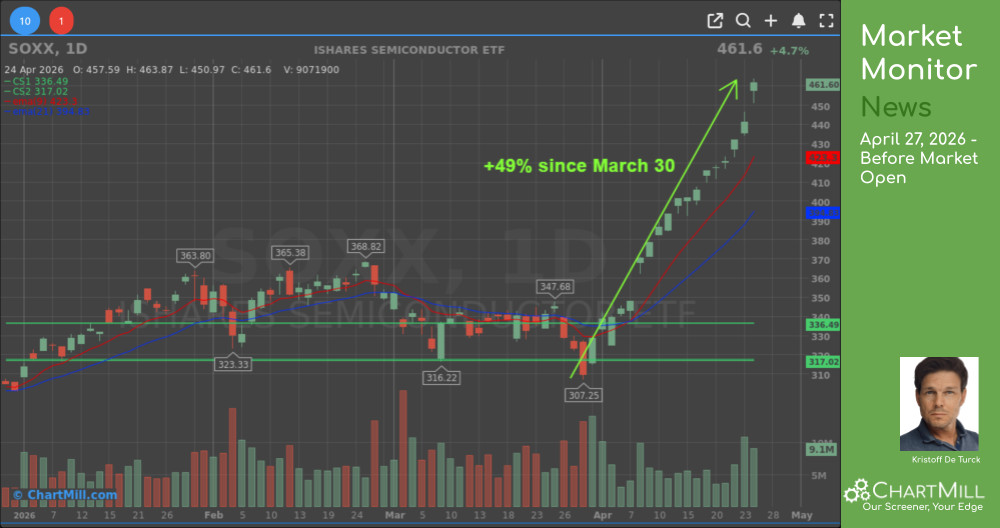
The current stock price of SOXX is 465.75 USD. Today SOXX is up by 0.93%. In the past month the price increased by 37.14%. In the past year, price increased by 145.09%.
SOXX Key Statistics
52-Week Range184.27 - 466.91
Current SOXX stock price positioned within its 52-week range.
1-Month Range338.47 - 466.91
Current SOXX stock price positioned within its 1-month range.
- Market Cap
- N/A
- P/E
- N/A
- Fwd P/E
- N/A
- EPS (TTM)
- N/A
- Dividend Yield
- N/A
SOXX Stock Performance
Today
+0.93%
1 Week
+0.90%
1 Month
+37.14%
3 Months
+34.49%
Longer-term
6 Months +51.93%
1 Year +145.09%
2 Years +99.03%
3 Years +193.11%
5 Years +222.93%
10 Years +1,371.26%
SOXX Stock Chart
SOXX Technical Analysis
ChartMill assigns a technical rating of 10 / 10 to SOXX. When comparing the yearly performance of all stocks, SOXX is one of the better performing stocks in the market, outperforming 95.04% of all stocks.
Chartmill TA Rating
Chartmill Setup Rating
SOXX Latest News, Press Relases and Analysis
ISHARES SEMICONDUCTOR ETF / SOXX FAQ
What is the stock price of ISHARES SEMICONDUCTOR ETF today?
The current stock price of SOXX is 465.75 USD. The price increased by 0.93% in the last trading session.
What is the ChartMill rating of ISHARES SEMICONDUCTOR ETF stock?
SOXX has a ChartMill Technical rating of 10 out of 10.You can find more details on the Technical Analysis and Fundamental Analysis tabs.