
For technical investors, finding stocks that are in a solid uptrend and ready for their next rise is a central method. One way to locate these chances is by searching for stocks with a high technical health score and a high setup quality score. The reasoning is simple: first, you aim to invest in a stock that is already showing market leadership and a positive direction. Second, you want to join that direction at a good time, usually after a phase of sideways movement, instead of following a long price run. This method tries to follow momentum while looking to control risk through careful entry points.
ZIM Integrated Shipping Services Ltd. (NYSE:ZIM) has recently appeared in such a search, showing a profile that deserves more attention from a technical view. The container shipping company, which runs a worldwide network, displays interesting chart traits that indicate it could be getting ready for a notable price change.
Technical Health: A Base of Strength
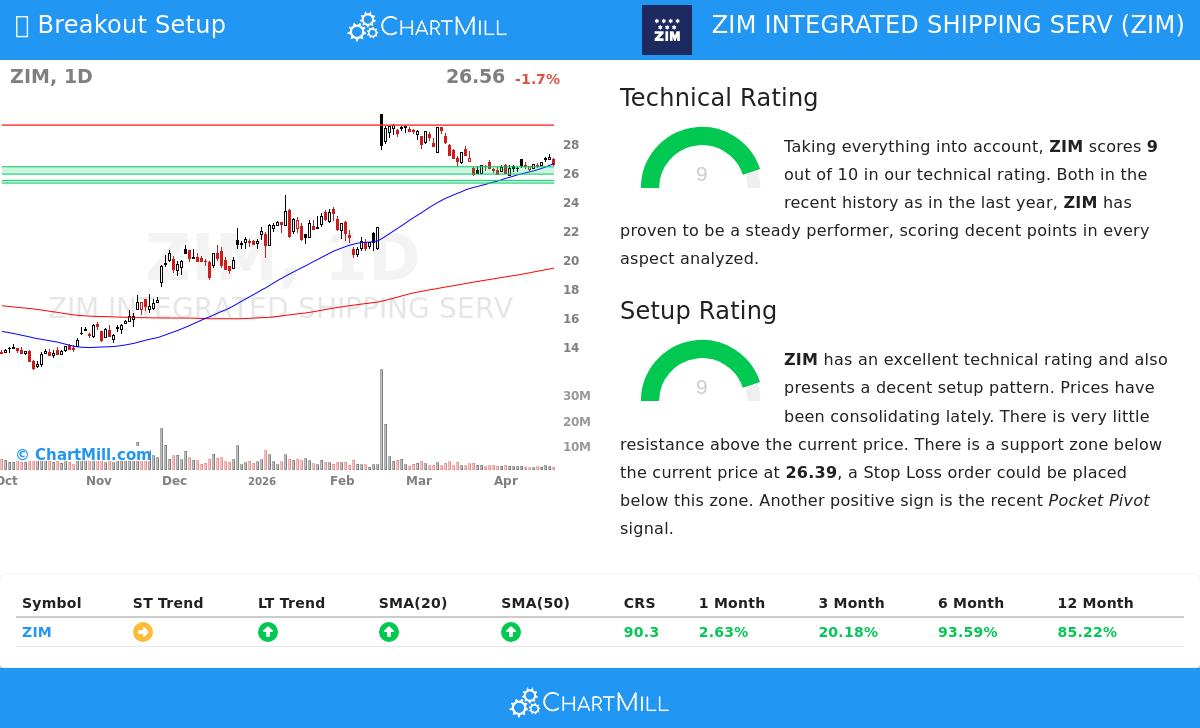
The main filter in a breakout search is a stock's basic technical condition, as a solid trend helps a trade. ZIM's technical rating is a strong 9 out of 10, putting it with the market's leaders from a chart view. This high rating is built on several points of strength seen in its price movement.
- Long-Term Trend: The long-term trend for ZIM is positive. This is the most important part for a momentum-based plan, showing the wider direction is up.
- Relative Performance: The stock's yearly gain beats 90% of the wider market, and it is in the high group of its Marine Transportation industry, doing better than 70% of similar companies. This relative performance is a main sign of institutional interest and demand.
- Moving Average Alignment: A sign of a good trend is when shorter-term averages are above longer-term ones. ZIM's price is now above its rising 20, 50, 100, and 200-day simple moving averages, confirming a positive structure across several time periods.
- Positioning: The stock is trading in the high part of its 52-week range, which goes from $12.33 to $29.97. While it is not at a new peak, its place points to steady buying activity over the mid term.
This combination of elements makes a positive setting. For the breakout plan, a high technical rating answers the "which stock" question by selecting those with shown momentum, raising the chance that a breakout will follow the current trend instead of a false move. A full look at these points is in the full ChartMill technical report for ZIM.
Setup Quality: Finding the Entry Area
A solid trend alone is not a buy sign; entering after a fast, long rise can be dangerous. This is where the setup quality score becomes key, answering the "when to buy" question. ZIM also gets a 9 out of 10 on this point, showing it is in a good consolidation shape.
- Narrow Consolidation: The technical report states that over the last month, ZIM has been trading in a narrow area between $25.77 and $27.27. This kind of price tightening, after a prior climb, often comes before a directional move as supply and demand find a short-term balance.
- Clear Support and Resistance: The study finds a clear support area between $25.88 and $26.39, made by a mix of trendlines and moving averages. Just above the present price, resistance is low until the $29.27 zone. This shape gives a logical area for a stop-loss order below support and a clear path for price gain on a breakout.
- Supportive Signs: A recent "Pocket Pivot" sign was seen, a volume-based sign that points to accumulation by bigger participants during the consolidation phase, adding another check to the setup.
The high setup score means the stock is not stretched. Instead, it has been absorbing its gains in a steady way, forming a base from which it can try its next climb. This lets a trader set a specific, lower-risk entry point just above the consolidation area, with a protective stop placed below the known support.
A Possible Trading Plan
From this study, the automated report shows a specific, though example-based, trading setup. It suggests an entry on a buy-stop order at $26.58, which is just above an important moving average, with a stop-loss order at $26.05, placed below the nearby support area. This would mean a risk of about 2% on the trade itself.
It is important to see this as an example model, not specific guidance. Every investor must adjust their entry, exit, and position size to their own risk comfort and plan. The worth of the search is in pointing out ZIM as a stock that now meets strict technical and setup conditions, making it a subject for more research.
Finding More Chances
ZIM shows one present example of the type of chance this screening method tries to find. Market situations shift each day, and new setups keep appearing. Investors curious about using this plan to find other possible breakout subjects can run the search themselves.
Click here to view the current Technical Breakout Setups screen for a fresh list of stocks showing both high technical ratings and high setup quality scores.
Disclaimer: This article is for information only and is not investment advice, a suggestion, or an offer or request to buy or sell any securities. The study is based on technical data and automated reports, which can change. All investing and trading includes risk, including the possible loss of capital. Readers should do their own research and talk with a qualified financial expert before making any investment choices. Past results do not guarantee future outcomes.