
Unearth the potential of WILLIAMS-SONOMA INC (NYSE:WSM) as a dividend stock recommended by our stock screening tool. NYSE:WSM maintains a robust financial footing and delivers a sustainable dividend. We'll delve into the details below.
Dividend Examination for NYSE:WSM
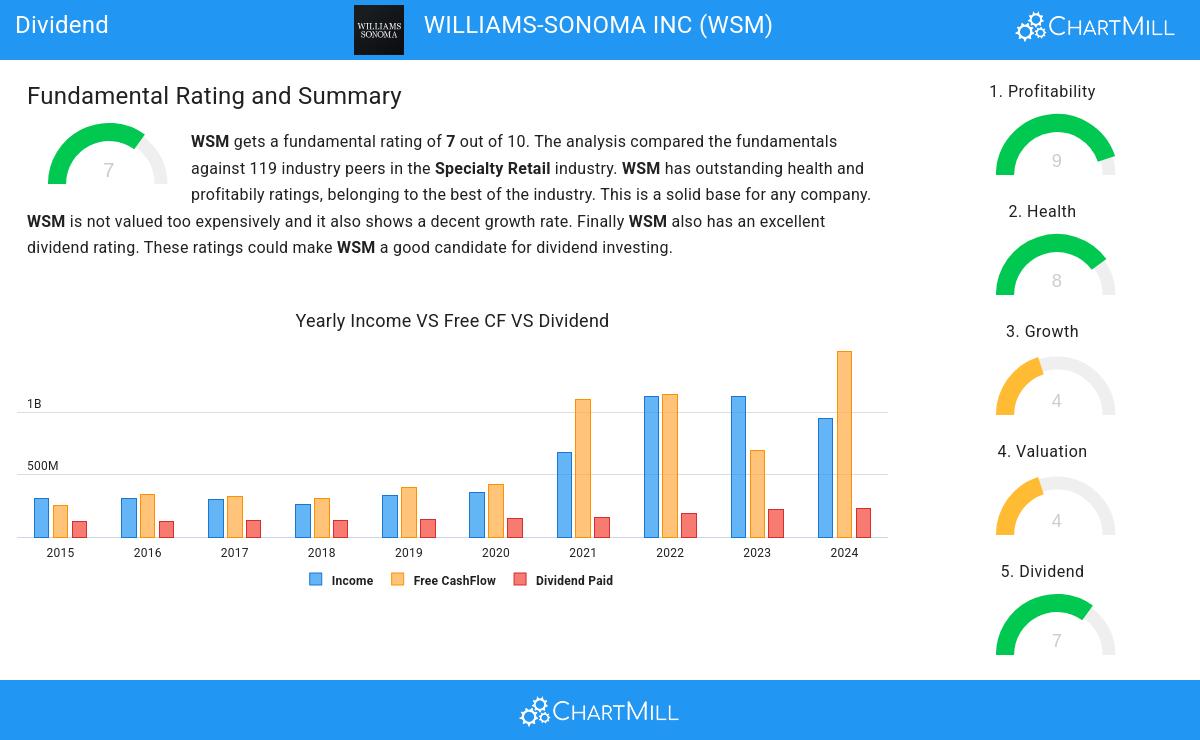
An integral part of ChartMill's stock analysis is the Dividend Rating, which spans from 0 to 10. This rating evaluates diverse dividend factors, including yield, historical data, growth, and sustainability. NYSE:WSM has received a 7 out of 10:
- WSM's Dividend Yield is a higher than the industry average which is at 3.45.
- On average, the dividend of WSM grows each year by 6.72%, which is quite nice.
- WSM has been paying a dividend for at least 10 years, so it has a reliable track record.
- WSM has not decreased its dividend for at least 10 years, so it has a reliable track record of non decreasing dividend.
- 24.36% of the earnings are spent on dividend by WSM. This is a low number and sustainable payout ratio.
- The dividend of WSM is growing, but earnings are growing more, so the dividend growth is sustainable.
Understanding NYSE:WSM's Health
ChartMill employs its own Health Rating for stock assessment. This rating, ranging from 0 to 10, is calculated by examining various liquidity and solvency ratios. In the case of NYSE:WSM, the assigned 8 reflects its health status:
- An Altman-Z score of 7.68 indicates that WSM is not in any danger for bankruptcy at the moment.
- The Altman-Z score of WSM (7.68) is better than 95.73% of its industry peers.
- WSM has no outstanding debt. Therefor its Debt/Equity and Debt/FCF ratios are 0 and belong to the best of the industry.
- The current and quick ratio evaluation for WSM is rather negative, while it does have excellent solvency and profitability. These ratios do not necessarly indicate liquidity issues and need to be evaluated against the specifics of the business.
Exploring NYSE:WSM's Profitability
ChartMill's Profitability Rating offers a unique perspective on stock analysis, providing scores from 0 to 10. These ratings consider a wide range of profitability metrics and margins, both in comparison to industry peers and on their own merits. For NYSE:WSM, the assigned 9 is a significant indicator of profitability:
- WSM has a better Return On Assets (22.04%) than 99.15% of its industry peers.
- WSM has a Return On Equity of 57.42%. This is amongst the best in the industry. WSM outperforms 94.87% of its industry peers.
- The Return On Invested Capital of WSM (33.38%) is better than 97.44% of its industry peers.
- The Average Return On Invested Capital over the past 3 years for WSM is significantly above the industry average of 12.29%.
- Looking at the Profit Margin, with a value of 14.54%, WSM belongs to the top of the industry, outperforming 98.29% of the companies in the same industry.
- WSM's Profit Margin has improved in the last couple of years.
- WSM has a Operating Margin of 18.50%. This is amongst the best in the industry. WSM outperforms 95.73% of its industry peers.
- WSM's Operating Margin has improved in the last couple of years.
- The Gross Margin of WSM (46.75%) is better than 71.79% of its industry peers.
- WSM's Gross Margin has improved in the last couple of years.
Every day, new Best Dividend stocks can be found on ChartMill in our Best Dividend screener.
Our latest full fundamental report of WSM contains the most current fundamental analsysis.
Keep in mind
This article should in no way be interpreted as advice. The article is based on the observed metrics at the time of writing, but you should always make your own analysis and trade or invest at your own responsibility.