
Technical investors often look for stocks showing both good momentum and consolidation patterns that indicate possible breakout chances. One methodical way involves filtering for securities with high technical ratings, showing good price trends, mixed with high setup quality scores that point out times of price consolidation. This process tries to find stocks that are not only technically healthy but also placed at possible entry spots, giving better risk control through clear support levels. WARNER BROS DISCOVERY INC (NASDAQ:WBD) recently appeared from this kind of filtering process, showing features that match these standards closely.
Technical Condition
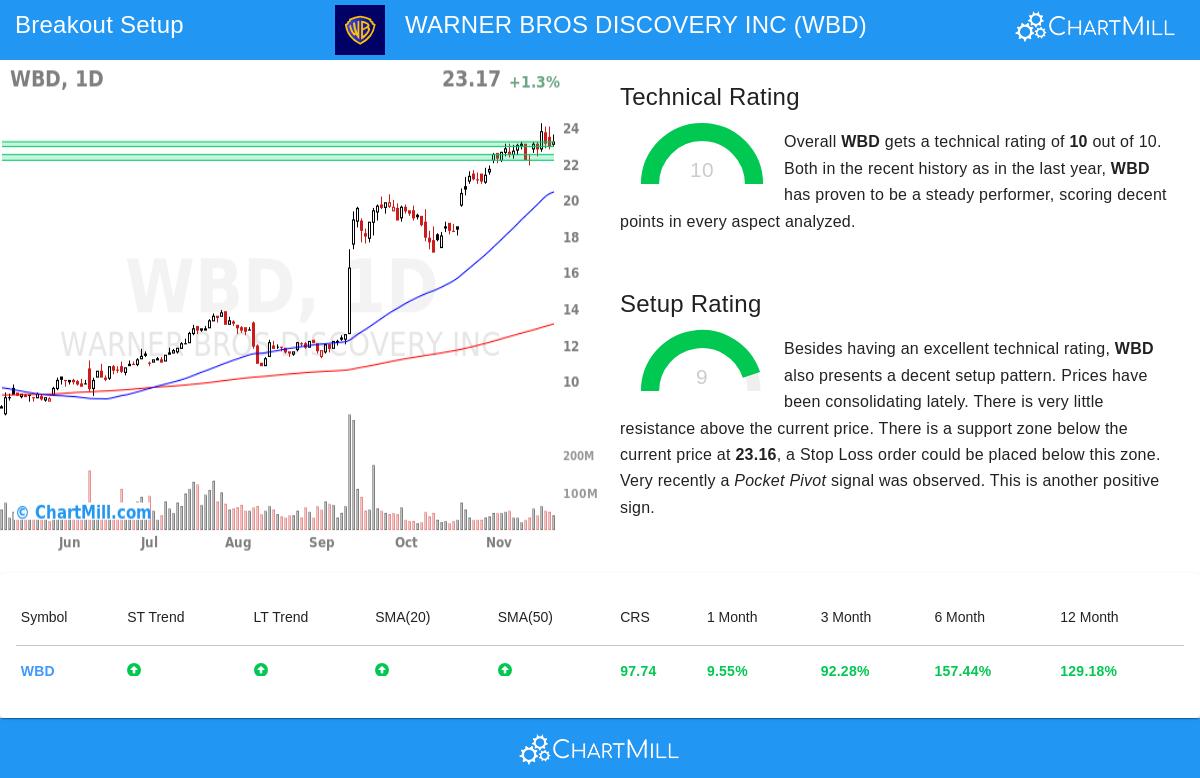
Warner Bros. Discovery shows very good technical condition, getting a perfect Technical Rating of 10 from ChartMill. This high rating shows good performance over different time periods and technical measures, which is important for the breakout plan as it makes sure the stock is in a set uptrend before looking at entry spots. The technical report points out several main good points:
- Both short-term and long-term trends are clearly positive, a key base for continuation patterns
- The stock is doing better than 97% of all market securities and 98% of its entertainment industry friends
- Price is trading close to 52-week highs while the wider S&P500 stays below its highs, showing leadership
- All main moving averages (20-day through 200-day) are going up and placed below the current price
These technical features make a good setting for breakout moves, as the stock has already set strong momentum over different time periods. The steady upward path over daily and weekly charts suggests institutional backing and continued buying pressure, both needed parts for good breakout trades.
Setup Quality and Pattern Development
Besides its strong technical base, Warner Bros. Discovery shows an interesting setup pattern with a Setup Quality Rating of 9. This high score means the stock has been consolidating lately, making a base that might come before another move higher. For breakout traders, this consolidation time is important as it gives a clearer meaning of support and resistance levels, allowing more exact entry and stop-loss placement.
The technical study shows several supportive facts for the current setup:
- Three separate support zones have formed, with the closest going from $22.90 to $23.16
- A recent Pocket Pivot signal happened, showing accumulation by institutional investors
- The stock has been trading in a set range between $20.82 and $24.19 over the last month
- Very little overhead resistance remains above current price levels
The mix of set support below current prices and small resistance above makes good asymmetry for breakout traders. The automatically made trading setup suggests an entry above $24.20 with a stop-loss below $22.89, showing a controllable risk of about 5.4% for the trade.
Market Situation and Relative Performance
While the S&P500 shows mixed signs with a negative long-term trend but positive short-term momentum, Warner Bros. Discovery is notable with clear strength over all time periods. The stock's notable relative performance, gaining over 157% in six months and 129% over twelve months, shows its market leadership. This better performance compared to the wider market is especially notable given the difficult setting for many entertainment stocks.
The large trading volume, averaging over 41 million shares daily, gives good liquidity for position entry and exit. The stock's ability to keep its upward path while sometimes consolidating shows healthy price action typical of lasting trends rather than speculative jumps.
Trading Points
For technical traders looking at this setup, several facts deserve notice. The nearness to the 52-week high at $24.19 shows both a chance and a point to think about, as breakouts to new highs can either speed up gains or meet profit-taking. The multiple support zones found in the technical study give possible areas for changing position sizing or stop-loss levels based on personal risk tolerance.
The Average True Range of about 3.47% points to moderate daily volatility, which should be included in position sizing math. Traders might also think that the stock has already had big appreciation over recent months, though the continued strong technical ratings suggest the trend remains in place.
Investors interested in finding similar technical breakout chances can get updated filtering results through the Technical Breakout Setups screen, which regularly finds stocks meeting these technical and setup standards.
Disclaimer: This study is based on technical measures and pattern recognition and should not be taken as investment advice. The noted trade setup is automatically made for example reasons. Always do your own research, think about your risk tolerance, and talk with a financial advisor before making investment choices. Technical study does not promise future performance and should be used as one tool among many in investment decision-making.