
For technical investors, finding stocks that are in a solid uptrend and ready for their next move is a central task. One way to address this is by looking for stocks that join sound technical condition with a good consolidation pattern, indicating a possible breakout. This method uses two specific scores from ChartMill: the Technical Rating, which measures a stock's general trend condition, and the Setup Quality Rating, which evaluates the compactness of its recent price action to locate good entry points. A stock with high marks on both measures can offer an interesting chance, as it indicates a solid trend is resting to build energy before possibly continuing.
Suncor Energy Inc (NYSE:SU), the Canadian integrated energy company, now appears as a clear example of this pattern. The firm, with work in oil sands development, refining, and a large retail system, displays technical traits that match the breakout screening approach.
Technical Condition: The Base of the Trend
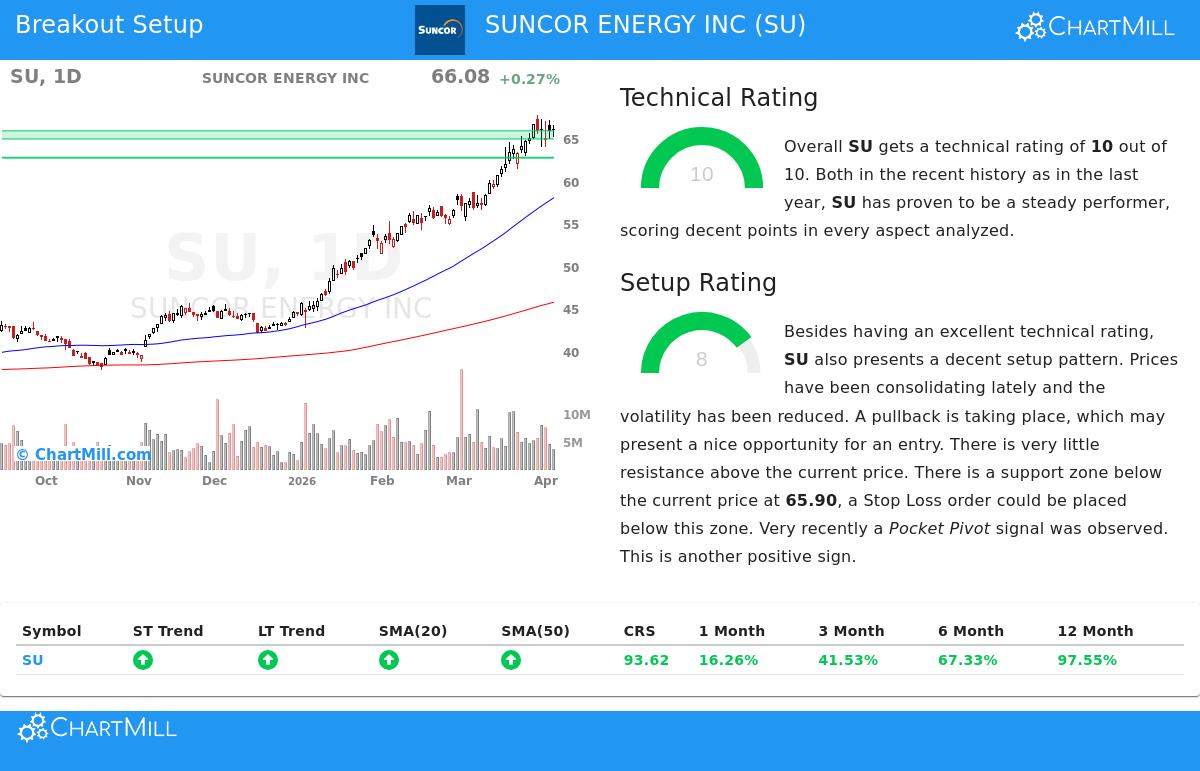
The first part of a breakout candidate is a solid and confirmed uptrend. ChartMill's Technical Rating for SUNCOR ENERGY INC is a full 10 out of 10, putting it with the market's technically sound leaders. This score is not given without reason; it shows a steady and solid result across various time periods and technical measures.
- Trend Agreement: Both the long-term and short-term trends for SU are marked as positive. This agreement is key, as it shows continued buying interest without major disagreement between different time frames.
- Strong Relative Performance: The stock's yearly result puts it in the top 7% of all stocks, doing better than 93% of the market. Significantly, it is ahead of the wider S&P 500, now trading close to its own 52-week high while the index is not.
- Moving Average Backing: The stock's price is trading above all its main simple moving averages (20, 50, 100, and 200-day), and each of these averages is in a rising state. This ordered, rising moving average arrangement is a known sign of a solid bullish trend.
- Sector Performance: Inside the active Oil, Gas & Consumable Fuels field, SU is doing better than 74% of its 209 competitors, showing strength relative to its sector.
This notable technical rating addresses the "which stock" question for investors. It verifies that SU is not in a short-lived rise but is in a confirmed, high-likelihood uptrend, making it a fitting candidate for more setup study. You can see the complete technical details in the ChartMill Technical Report for SU.
Setup Condition: Locating the Entry Area
A solid trend by itself is not a buy signal; entering after a fast, long move can be hazardous. The second part, the Setup Quality Rating, deals with the "when" to buy. SU receives a high Setup Rating of 8, showing it is in a forming consolidation phase inside its bigger uptrend.
- Bull Flag Pattern: The technical report states that SU is now displaying a bull flag pattern. This is a continuation pattern where prices decline slightly in a compact range after a solid rise, often coming before the next breakout move.
- Lower Volatility & Consolidation: The high setup score is linked to prices consolidating recently with lower volatility. This coiling action usually builds energy for the next directional move.
- Clear Support and Risk Control: The study finds a clear support area between $64.94 and $65.90, made by a combination of trendlines and moving averages. This gives a logical zone below which to set a protective stop-loss order, setting the trade's risk from the start.
- Positive Volume Sign: A recent "Pocket Pivot" sign—where the stock rises on volume greater than the highest down volume in the previous 10 days—adds a positive detail, suggesting accumulation during the consolidation.
This setup condition means the stock is not overstretched. Instead, it is giving a possible entry point with a close support level to control risk, which is necessary for carrying out a planned breakout strategy.
Trade Plan and Market Setting
From this study, ChartMill's system indicates a specific trade plan. It suggests an entry on a breakout above the recent range at $67.77, with a stop-loss set just below the found support area at $64.93. This sets a risk of about 4.2% on the trade itself. It is important to state that this is an example created from the technical factors; investors should always do their own study to decide entry, exit, and position size that fit their individual risk comfort.
The wider market setting adds a notable layer. While SU shows solid positive trends, the S&P 500's long and short-term trends are now negative. SU's capacity to trade near 52-week highs in this setting highlights its notable relative performance, a key trait for possible leadership when the wider market steadies.
Locating Comparable Chances
SUNCOR ENERGY INC shows the kind of chance technical breakout screens are made to find: a stock with top-level trend condition pausing before its possible next rise. For investors wanting to use this method to find other candidates, the process can be repeated daily using the set screen.
You can locate today's new breakout setups by going to the Technical Breakout Setups screen on ChartMill.
Disclaimer: This article is for information only and does not form investment advice, a suggestion, or an offer or request to buy or sell any securities. The study shown is based on technical data and automated scoring models. All investing and trading includes risk, including the possible loss of principal. Investors should do their own separate research and talk with a qualified financial advisor before making any investment choices. Past results are not a guide for future results.