SPX Technologies (SPXC) is shaping up as a classic swing-trade candidate: strong longer-term trend, solid (and recently accelerating) growth metrics, and price currently tightening just beneath a well-defined horizontal resistance zone.
Below is how I’d break down the setup and map out a practical trade plan.
! Be aware: Next Earnings > 2026-02-24/amc !
Disclaimer: This article is for informational and educational purposes only and should not be considered financial, investment, or trading advice. Always do your own research and consult a qualified professional if needed. Trading involves risk, and you can lose more than you invest.
1) The Big Picture: Trend First, Then Setup
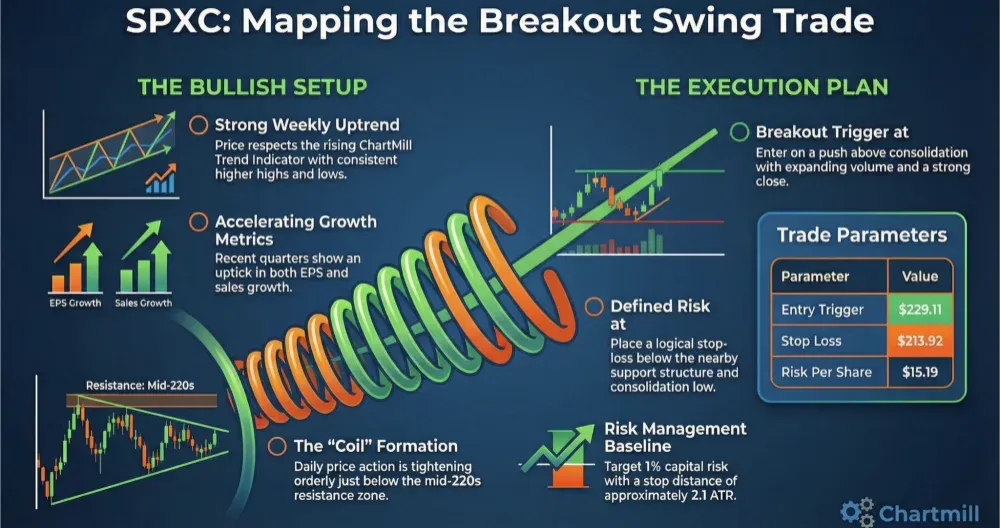
On the weekly chart, SPXC is in a clear uptrend. Price has been respecting the rising ChartMill Trend Indicator and continues to print higher highs and higher lows over the last year-plus.

That matters, because the best swing trades usually come from bullish primary trends, then you look for a low-risk entry when price pauses, digests, and prepares for the next push.
SPXC is now doing exactly that: consolidating near resistance, rather than failing hard and reversing.
2) Fundamentals: Evidence of Growth + Recent Acceleration
What makes this chart more interesting is that the business metrics support the trend:
-
EPS growth remains strong, and the most recent quarters show an uptick versus earlier in the year.
-
Sales growth also accelerated in the last two quarters compared to prior quarters.
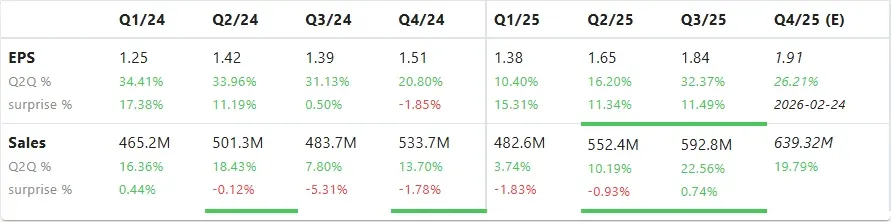
In other words: the chart is strong, and the underlying growth picture isn’t fighting it.
3) Daily Chart: Tightening Action Below a Clear Ceiling
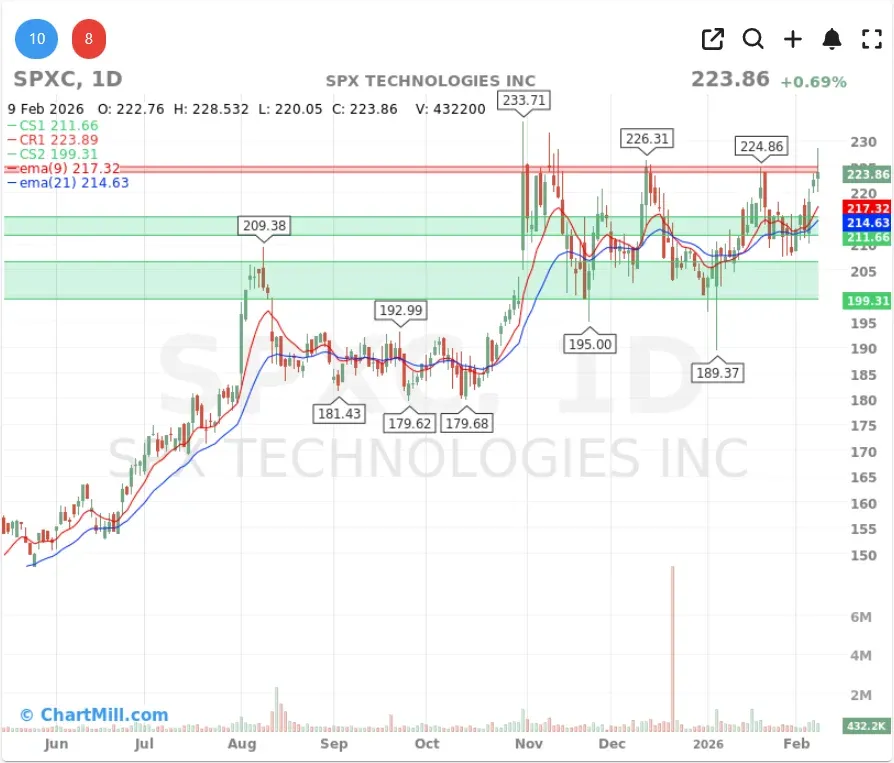
On the daily chart, SPXC is pressing into a major horizontal resistance area in the mid-220s (multiple prior peaks in that region). Price has repeatedly reacted there, which makes it a meaningful “decision level.”
What I like in this specific structure:
-
Price is not collapsing away from resistance, it’s holding close.
-
The pullbacks have been contained and relatively orderly.
-
Key moving averages (short-term and medium-term) are close enough to provide nearby technical support, which helps define risk.
This is the kind of “coil” that often precedes a breakout, assuming volume and broader market conditions cooperate.
How Did We Found This Setup?
We started with Mark Minervini’s Trend Template in ChartMill, to which we then added the following individual filters:
- Fundamental Rating: at least 6/10 - No earnings next week - Average Volume (50SMA): 500.000 (the basic templates uses 300.000)
This is the direct link to the screen that gave us 85 stocks (february 10 before market open).
4) Trade Plan: Breakout Trigger + Defined Risk
Because the stock is sitting right under resistance, I prefer a trigger-based entry (rather than buying into the wall and hoping).

Entry idea (breakout trigger)
A reasonable swing approach is to enter on a push above the consolidation range, ideally with expanding volume and a strong close.
One example trigger level used in the chart’s position sizing tool is around $229.11 (a “breakout + buffer” style entry to avoid getting chopped inside resistance).
Stop-loss idea (invalidation)
A logical stop is below the nearby support structure / consolidation low. The sizing tool example uses about $213.92.
That creates a clear “I’m wrong” level: if SPXC loses that area, the breakout thesis is likely failing and you don’t want to sit through a deeper pullback.
Risk snapshot (example)
Using the values shown in the position sizing calculator:
-
Entry: $229.11
-
Stop: $213.92
-
Risk per share: $15.19
-
Approx. ATR: $7.13 → stop distance ~2.1 ATR (reasonable for a breakout trade)
-
Example account: $25,000
-
Risk: 1% of capital → position size around 16 shares (example)
Adjust sizing to your own account and risk rules.
5) Profit Targets and Trade Management
Since this is a breakout-style swing trade, I typically think in zones, not one exact price:
-
First objective: a clean breakout and hold above resistance (this is where you want to see strength quickly).
-
Next: a retest/continuation push toward the prior high area (if price breaks out but immediately fails back into the range, that’s a warning sign).
-
Management idea: if SPXC breaks out and runs, consider reducing risk by moving the stop up after a strong follow-through day or after a successful retest.
Breakouts tend to either work fairly quickly or they don’t. The goal is to stay aligned with momentum, not “hope” through chop.
6) Key Risks to Watch
A few things that can derail this type of setup:
-
False breakouts (common when the market is choppy or breadth is weak)
-
Earnings/news risk (always check the calendar - SPX Technologies next earnings release is scheduled for 2026-02-24/amc )
-
Market regime: even the best-looking breakouts struggle when indexes are under distribution
Bottom Line
SPXC checks a lot of swing-trader boxes:
-
Weekly uptrend intact
-
Daily consolidation right beneath a well-defined resistance zone
-
Improving growth profile, with recent acceleration in sales and EPS growth
The cleanest plan is to wait for confirmation: a breakout above the range (e.g., around the high-220s trigger) with a stop below support (low- to mid-210s), then manage based on follow-through and how price behaves around the breakout level.
Trade safe!
Kristoff - ChartMill
Disclaimer: This article is for informational and educational purposes only and should not be considered financial, investment, or trading advice. Always do your own research and consult a qualified professional if needed. Trading involves risk, and you can lose more than you invest.