
Investors aiming to benefit from the next group of market leaders frequently use a two-part method, combining the future-oriented study of company basics with the precise timing tools of chart analysis. One specific tactic looks for stocks that show solid business growth—marked by strong revenue and earnings increases, good profit levels, and a stable financial position—while also showing a positive pattern on their price charts. This method tries to find companies with attractive future possibilities that are also nearing a possible price move upward, providing a mix of business quality and market timing. Penumbra Inc (NYSE:PEN), a medical device firm focused on new thrombectomy systems, recently appeared from this kind of search, justifying a more detailed look at its investment case.
Fundamental Strength: The Driver for Growth
At its heart, a good growth stock needs to show it can grow its business faster than average while keeping its finances sound. Penumbra’s fundamental report, which can be studied fully here, shows a company performing well in several important areas. The report gives PEN a total fundamental score of 7 out of 10, with especially high marks in Growth (8), Profitability (8), and Health (8).
-
Strong Growth Path: The company's growth numbers are a main point of interest. In the last year, Penumbra reached a 33.80% growth in Earnings Per Share (EPS) and a 17.50% rise in Revenue. More notably, its average yearly EPS growth over recent years is a significant 84.42%, with revenue growing more than 20% each year. Analysts think this pace will persist, predicting future yearly EPS growth of 23.81% and revenue growth of 13.43%. This steady and solid expansion in sales and profits is the sign of a true growth company, meeting the basic search's main need for "stocks which are growing strongly."
-
Good Profitability and Financial Health: Strong growth cannot last without sound finances. Penumbra performs well here, with profit scores that rank it with the top in the Health Care Equipment & Supplies industry. It has a Return on Equity of 12.45% and a good Operating Margin of 13.48%, both numbers better than most of its competitors. Financially, the company is in a very strong position with a very low Debt/Equity ratio of 0.01 and a high Current Ratio of 6.64, showing it has plenty of cash to run its business and fund new projects without difficulty. This "decent profitability and health," as needed by the search plan, gives a stable base that lowers risk and helps further growth.
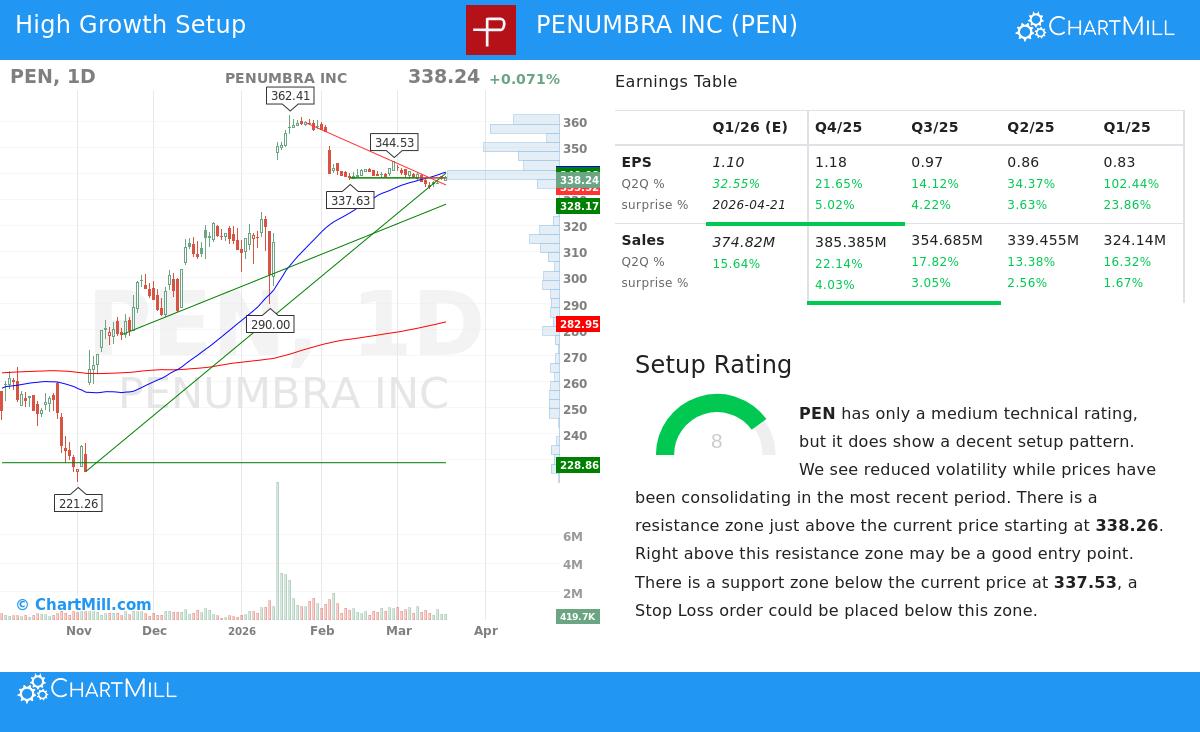
Technical Setup: The Chart's Indication for a Possible Move
While basics describe a company's inherent potential, chart study helps find good times to buy by examining price movement and market behavior. Penumbra’s technical analysis report, found here, points out a stock that is settling into a constructive formation. The report gives a technical score of 5 but, more critically, a setup score of 8, suggesting an encouraging chart pattern.
-
Settling Within a Longer-Term Upward Trend: PEN is in a clear longer-term positive trend, trading much higher than its rising 200-day average price. Lately, however, the stock has entered a period of lower price swings, trading in a narrow band between about $334 and $345 over the last month. This kind of settling after a previous rise often comes before the next price move.
-
A Clear Pattern for Market Participants: The technical report mentions a specific pattern chance. Prices have been settling, with decreasing price swings, and a set resistance area just above the current price around $338.26 to $340.47. A clear move above this area, especially with more shares trading, could indicate the longer-term upward trend is starting again and act as a possible signal for chart readers. On the other side, a clear support area exists below, around $328 to $338, giving a reasonable place for a protective stop-loss order. This formation of settling near high prices, with clear resistance and support points, is exactly the sort of "technical breakout pattern" the search method aims to find.
Valuation Context
It is necessary to note that growth of this level is seldom low-priced. Penumbra trades at a high Price-to-Earnings (P/E) ratio of 88.08, which is costly compared to the wider S&P 500. However, within its fast-growth medical technology industry group, its price is more acceptable, ranking lower than about 65% of its industry peers. The high price reflects the market's anticipation for continued fast growth and the company's top spot in the changing field of mechanical thrombectomy. For growth-focused investors, the price is often evaluated alongside the growth rate and the strength of the company's competitive position.
Conclusion
Penumbra Inc shows a notable example of a stock that satisfies strict two-part search criteria. Fundamentally, it is a leader in a growing medical specialty, showing very fast and steady revenue and earnings growth supported by excellent profit levels and a very strong financial position. Technically, the stock is pausing after a good advance, forming a settling pattern that frequently comes before a new price move, as indicated by its high setup score. This match of a strong business driver with a chart positioned for its next possible advance is the core of the combined basic and technical search method.
Interested in finding other stocks that fit this profile of strong growth and encouraging chart patterns? You can perform the same search using our stock screener tool here.
Disclaimer: This article is for informational and educational purposes only and does not constitute a recommendation to buy, sell, or hold any security. The analysis is based on data and reports provided by ChartMill, and investing carries risks, including the potential loss of principal. Always conduct your own thorough research and consider consulting with a qualified financial advisor before making any investment decisions.