
The investment philosophy of legendary fund manager Peter Lynch, as detailed in his book One Up on Wall Street, centers on finding high-quality, growing companies trading at reasonable prices. This "Growth at a Reasonable Price" (GARP) method avoids speculative, high-flying stocks in favor of businesses with sustainable expansion, strong financial health, and attractive valuations. A key tool for finding such opportunities is the Peter Lynch stock screen, which filters for companies with consistent earnings growth, solid profitability, manageable debt, and a valuation that compensates investors for that growth. One name that recently appeared from such a screen is Paycom Software Inc (NYSE:PAYC).
A Closer Look at Paycom Software
Paycom Software provides a full, cloud-based human capital management (HCM) platform. Its software-as-a-service solution handles the entire employee lifecycle, from recruitment and onboarding to payroll, benefits administration, and performance management, within a single, unified system. Headquartered in Oklahoma City, the company has built its reputation on a product that requires little customization, offering businesses efficiency and employees direct access to manage their own data. This focus on an integrated platform in the essential area of HR and payroll forms the base of its durable business model.
How Paycom Aligns with the Peter Lynch Screen
The Peter Lynch screen uses specific quantitative filters to find companies that fit the GARP mold. Paycom’s financial profile demonstrates a clear alignment with these core ideas.
- Sustainable Earnings Growth: Lynch favored companies growing steadily, not explosively. The screen looks for a 5-year earnings per share (EPS) growth rate between 15% and 30%. Paycom’s EPS has grown at an average annual rate of 21.5% over the past five years, comfortably within this target range. This indicates a history of strong, yet potentially sustainable, profitability expansion.
- Reasonable Valuation (The PEG Ratio): Perhaps the most critical Lynch metric is the Price/Earnings to Growth (PEG) ratio, which aims to find stocks where the price is justified by the growth rate. A PEG ratio at or below 1.0 is considered attractive. Paycom’s PEG ratio, based on its past five-year growth, stands at 0.65. This suggests the market may be undervaluing the company’s historical growth path.
- Strong Profitability (Return on Equity): Lynch sought companies that efficiently generate profits from shareholder equity. The screen requires a Return on Equity (ROE) above 15%. Paycom far exceeds this hurdle with an ROE of 26.2%, placing it among the top performers in its industry and signaling highly effective management.
- Financial Health (Debt and Liquidity): A conservative balance sheet was paramount for Lynch. The screen filters for a Debt-to-Equity ratio below 0.6 and a Current Ratio above 1.0. Paycom performs well here, carrying no debt (Debt/Equity of 0.0) and maintaining a Current Ratio of 1.09, indicating it has enough short-term assets to cover its obligations.
Fundamental Analysis Overview
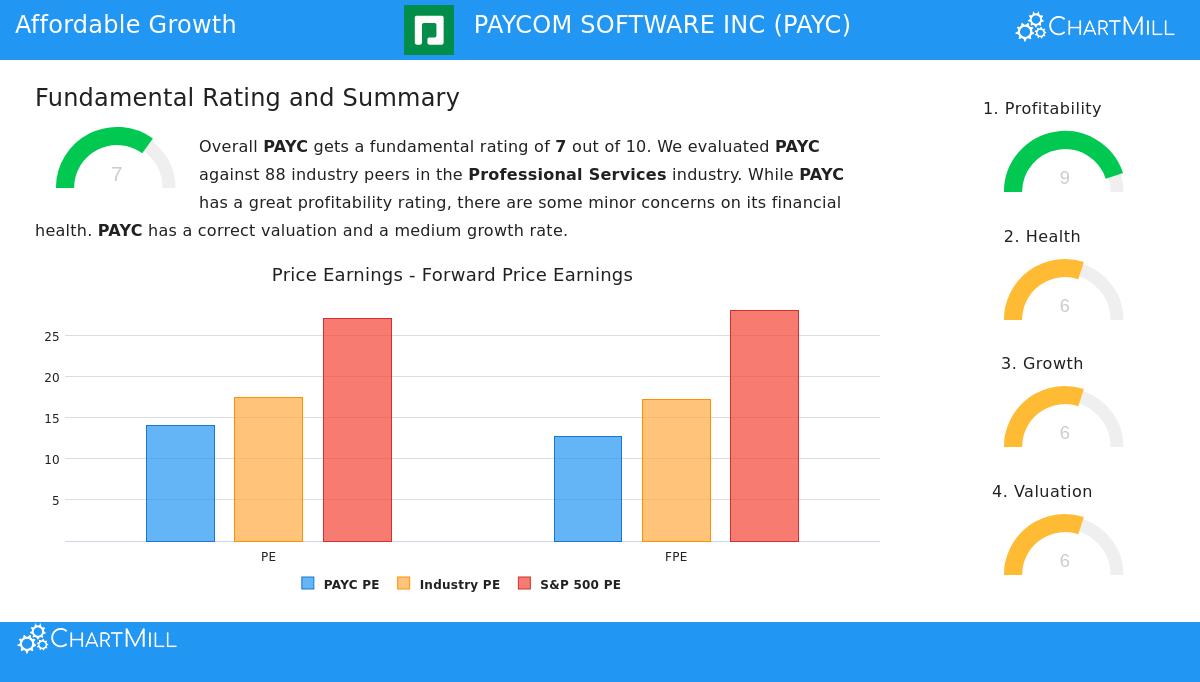
A broader fundamental analysis of Paycom supports the picture shown by the Lynch screen. The company earns a solid overall rating of 7 out of 10, with particular strengths in profitability, where it scores a 9. Its profit, operating, and gross margins rank in the top tier of the Professional Services industry. The valuation score of 6 indicates its shares are trading at a discount to both industry peers and the broader S&P 500 based on traditional P/E metrics.
The analysis does note some areas for consideration. While financial health is supported by the absence of debt, the company’s liquidity ratios are lower than many industry competitors. Furthermore, while future earnings growth is still projected to be strong, analysts expect a moderation in the pace of both revenue and EPS growth compared to the high rates of the past several years.
A Candidate for the Long-Term Investor
For an investor using a Peter Lynch-style strategy, Paycom Software presents an interesting case study. It operates in the essential, recurring-revenue domain of HCM software, a "dull" but critical area Lynch might appreciate. The company combines a history of strong, above-average growth with exceptional profitability and a clean, debt-free balance sheet. Importantly, this is available at a valuation that appears reasonable, especially when growth is factored in via the low PEG ratio. It represents the principle of paying a sensible price for a quality growing business.
The Peter Lynch screen is a starting point for deeper research, not a buy list. Investors can review other companies that currently pass this disciplined set of criteria by viewing the full screen results here.
Disclaimer: This article is for informational purposes only and does not constitute financial advice, a recommendation, or an offer to buy or sell any security. Investing involves risk, including the potential loss of principal. You should conduct your own thorough research and consider consulting with a qualified financial advisor before making any investment decisions.