
When hunting for technical breakout opportunities, the goal is to identify stocks that combine a strong underlying trend with a well-defined consolidation pattern. The stock must not only be moving in the right direction but also be forming a base that offers a clean entry point with a manageable risk profile. This dual approach—filtering for both technical health and setup quality—helps traders avoid chasing extended rallies and instead focus on stocks that are coiled for a potential next leg higher. We recently screened for exactly this combination, and Omega Healthcare Investors Inc. (NYSE:OHI) emerged as a standout candidate, earning top-tier scores on both the proprietary ChartMill Technical Rating and Setup Quality Rating.
Technical Strength: A Flawless Trend in Place
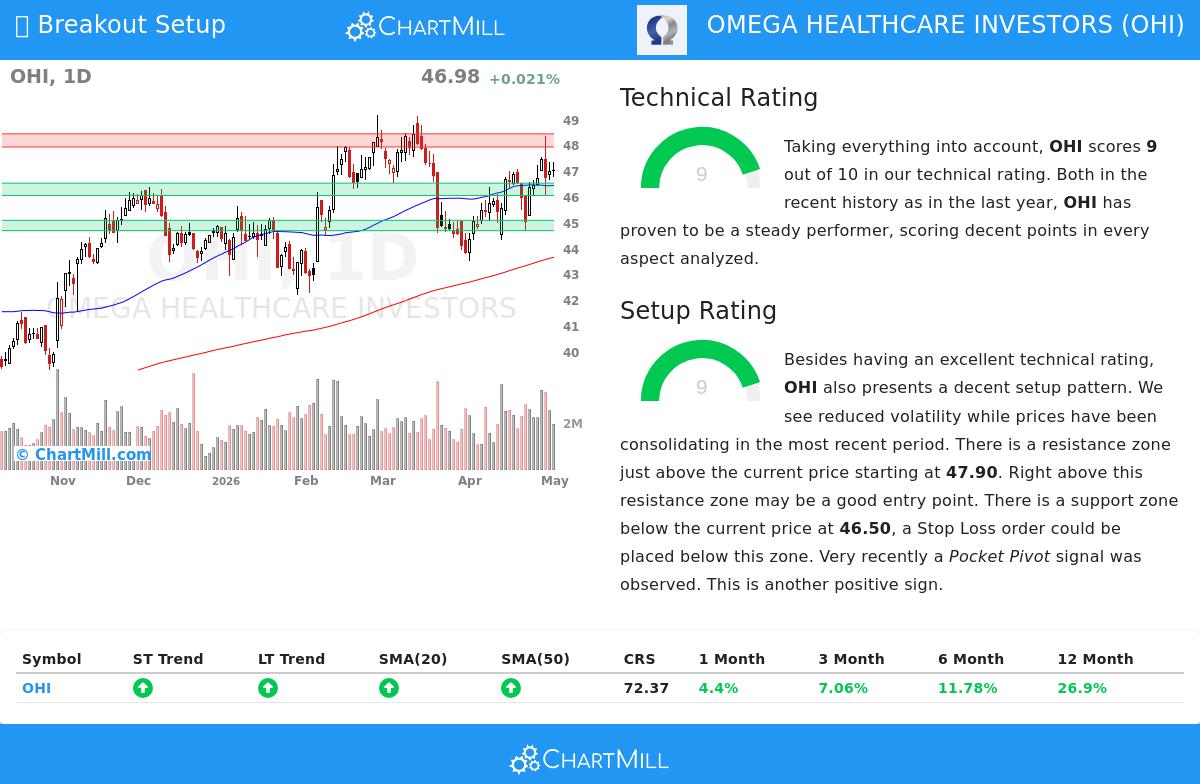
The foundation of any breakout setup is a strong, sustained uptrend. Without it, the breakout is far more likely to fail. OHI scores a 9 out of 10 on the ChartMill Technical Rating, placing it firmly in the top tier of technically healthy stocks. This score is not just a snapshot; it reflects a consistent performance across multiple time frames.
Looking at the key drivers behind this high rating:
- Trend Direction: Both the short-term and long-term trends are clearly positive. This is the most critical element, as it confirms the stock is moving in the direction of least resistance.
- Relative Strength: OHI outperforms 72% of all stocks in the market over the past year. More importantly, those gains have been steady and well-distributed, not a sharp spike that would suggest the move is exhausted.
- Industry Leadership: Within the Diversified REITs industry, OHI sits in the top tier, outperforming 76% of its 121 peers. This is a strong sign of sector leadership.
- Moving Average Structure: All key moving averages—the 20-day, 50-day, 100-day, and 200-day SMAs—are rising. The stock is currently trading well above its 200-day moving average of $43.63, a classic hallmark of a long-term uptrend.
This technical profile answers the "which" question in breakout trading: it points to a stock that has the momentum and structural integrity to support a continued move higher.
Setup Quality: The Perfect Consolidation
A strong trend alone is not a buy signal; the timing must be right. This is where the Setup Quality Rating comes in, and OHI scores a perfect 9 out of 10 here as well. The stock is currently forming a textbook consolidation pattern, which provides the framework for a low-risk entry.
Key aspects of the setup include:
- Price Consolidation: After a strong move higher, OHI has entered a tight trading range. This base-building behavior is exactly what technical traders look for before a potential breakout.
- Reduced Volatility: Volatility has been decreasing, a sign that the stock is "coiling" and building energy for its next move.
- Support and Resistance Zones: The analysis has identified a clear resistance zone from $47.90 to $48.41 just above the current price. Below, a solid support zone exists between $46.02 and $46.50. This creates a defined risk/reward scenario.
- Pocket Pivot Signal: A recent Pocket Pivot signal has been detected. This is a specific accumulation pattern where price moves up on volume higher than any down-volume day in the previous ten sessions. It’s a strong indicator of institutional buying.
This setup answers the "when" question. The suggested trade structure from the ChartMill Technical Report is a buy stop order placed just above the resistance zone at $48.42, with a protective stop loss just below the support zone at $46.01. This defines a worst-case loss of roughly 4.98%, which allows for sensible position sizing.
Actionable Insight
For technical investors, OHI presents a compelling case. The stock has the strong underlying trend necessary to support a breakout, and it has built the quiet consolidation pattern that provides a clean entry point with a defined risk. While the core criteria are met, manual checks for upcoming earnings or other company-specific news are always a prudent final step before executing any trade.
For those looking to identify similar opportunities, you can explore the full list of stocks that meet these exact stringent criteria in the Technical Breakout Setups Screener. This screener is designed to cut through the noise and present only the most promising patterns in the strongest stocks.
This article is for informational and educational purposes only and does not constitute investment advice. Always conduct your own research and consider your personal risk tolerance before making any trading decisions.