
The investment philosophy of legendary fund manager Peter Lynch, as detailed in his book One Up on Wall Street, centers on finding high-quality, growing companies trading at reasonable prices. This "Growth at a Reasonable Price" (GARP) method blends parts of growth and value investing, focusing on lasting business expansion, sound financial condition, and appealing valuations. Lynch supported investing in understandable businesses with steady earnings growth, controlled debt, and high returns on equity, all while making sure the stock price does not exceed the company's growth potential. A stock screener built on his rules can find possible candidates, which must then be carefully studied to verify their long-term quality.
Looking at INTUIT INC (NASDAQ:INTU) Using Lynch's Rules
A screen built on Peter Lynch's method recently found INTUIT INC (NASDAQ:INTU), the provider of financial software like TurboTax and QuickBooks. For a GARP investor, the interest comes from how the company's basic metrics match Lynch's main investment rules.
- Lasting Earnings Growth: Lynch looked for companies with solid but lasting growth, often between 15% and 30% each year. Intuit's earnings per share (EPS) have increased at an average yearly rate of 20.77% over the last five years. This puts it within Lynch's desired range, showing a sound and steady rise in profitability that is not so high as to be possibly temporary.
- Fair Valuation (PEG Ratio): A key part of Lynch's method is the Price/Earnings to Growth (PEG) ratio, which he liked to be at or under 1.0. This measure changes the standard P/E ratio for a company's growth rate, helping to find stocks that may be priced low considering their growth path. Intuit's PEG ratio, using its past five-year growth, is 0.94. This implies the market is pricing the company's shares at a level that is fair, if not somewhat interesting, compared to its historical earnings growth.
- Sound Profitability (Return on Equity): Lynch preferred companies that produce high returns on shareholder equity, a sign of effective management and a lasting competitive edge. Intuit's ROE of 22.78% is much higher than Lynch's minimum level of 15%, putting it with the best in its field and pointing to very good profitability.
- Good Financial Condition (Debt & Liquidity): A careful balance sheet was very important for Lynch. He preferred companies funded more by equity than debt, often wanting a Debt-to-Equity ratio below 0.25. Intuit's ratio of 0.28 is near this strict goal and shows little use of debt financing. Also, the company's Current Ratio of 1.32 meets Lynch's need for it to be at least 1.0, showing sufficient cash to meet near-term needs.
Basic Condition and View
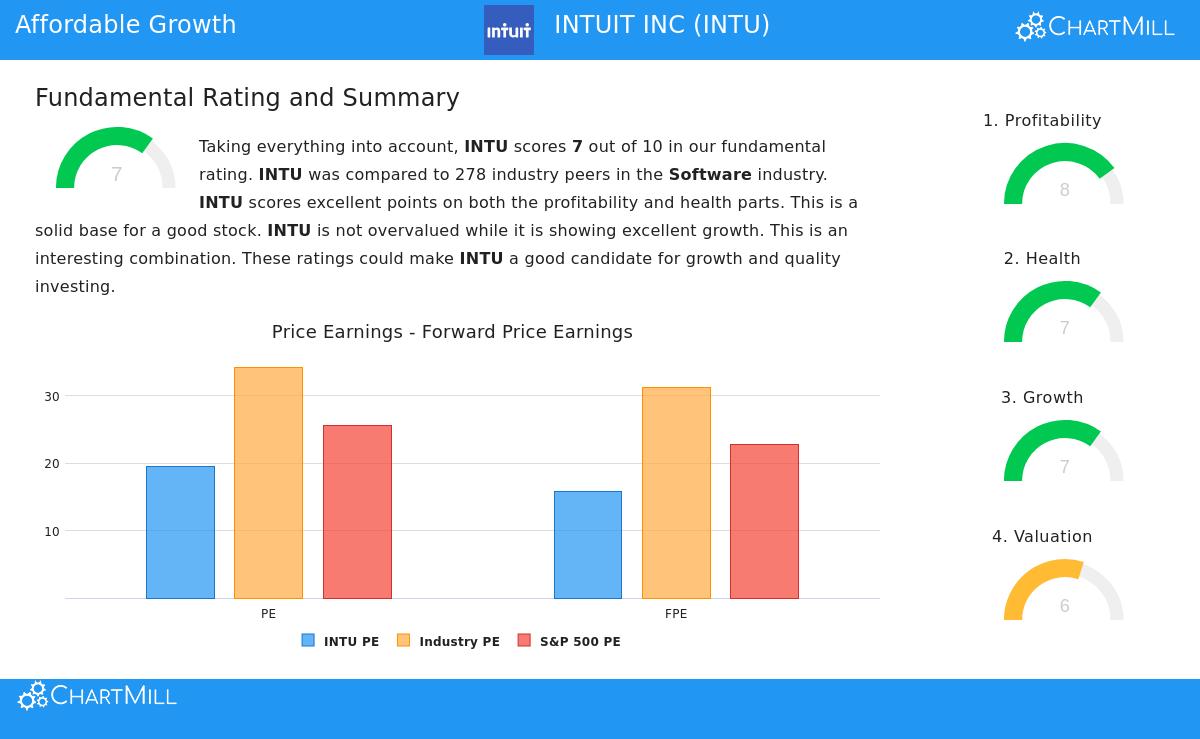
A wider fundamental analysis of Intuit supports the image shown by the Lynch screen. The company gets a solid overall basic rating of 7 out of 10, with very good marks in profitability and health. Its margins lead the industry, and its financial stability is very good, with an Altman-Z score pointing to very small bankruptcy risk. While the valuation seems fair instead of very low, it is less expensive than most of its software industry competitors. Growth stays solid, with revenue and earnings continuing to rise at a double-digit rate, though analysts expect a modest slowing from the high rates of the last few years.
A Candidate for More Study
For an investor using a Peter Lynch-style GARP method, Intuit shows an interesting profile. It works in the understandable area of financial and tax software, a "simple" area Lynch might like, and displays the signs he prized: lasting growth, high profitability, a strong balance sheet, and a valuation that accounts for its growth. It acts as a clear example of the kind of company his approach aims to find.
Find More Investment Ideas
The Peter Lynch method screen that found Intuit can produce other possible candidates for a long-term growth portfolio. You can review the present results and change the settings yourself using the Peter Lynch Strategy screen.
Disclaimer: This article is for informational purposes only and does not constitute financial advice, a recommendation, or an offer to buy or sell any securities. The Peter Lynch investment method is one of many approaches, and past performance of a screening tool is not a guide to future results. Investors should do their own complete research and think about their personal financial situation and risk tolerance before making any investment decisions.