
For investors who use technical analysis to find possible trades, a common method looks for stocks that are both technically sound and ready to move out of a period of sideways trading. This method tries to enter the next phase of an ongoing upward move by buying during a time of lower price swings, just before a possible price increase. A structured method to do this uses filters that search for two main proprietary scores: a high ChartMill Technical Rating, which verifies the stock's basic trend condition, and a high ChartMill Setup Quality Rating, which points to a narrow, formed price pattern that might come before an upward move.
CONSOLIDATED EDISON INC (NYSE:ED), the regulated utility company serving New York City and nearby regions, now shows a profile that fits this breakout method. While frequently seen as a steady, dividend-focused investment, the stock's recent technical activity indicates it could also provide a short-term chance for investors focused on trends.
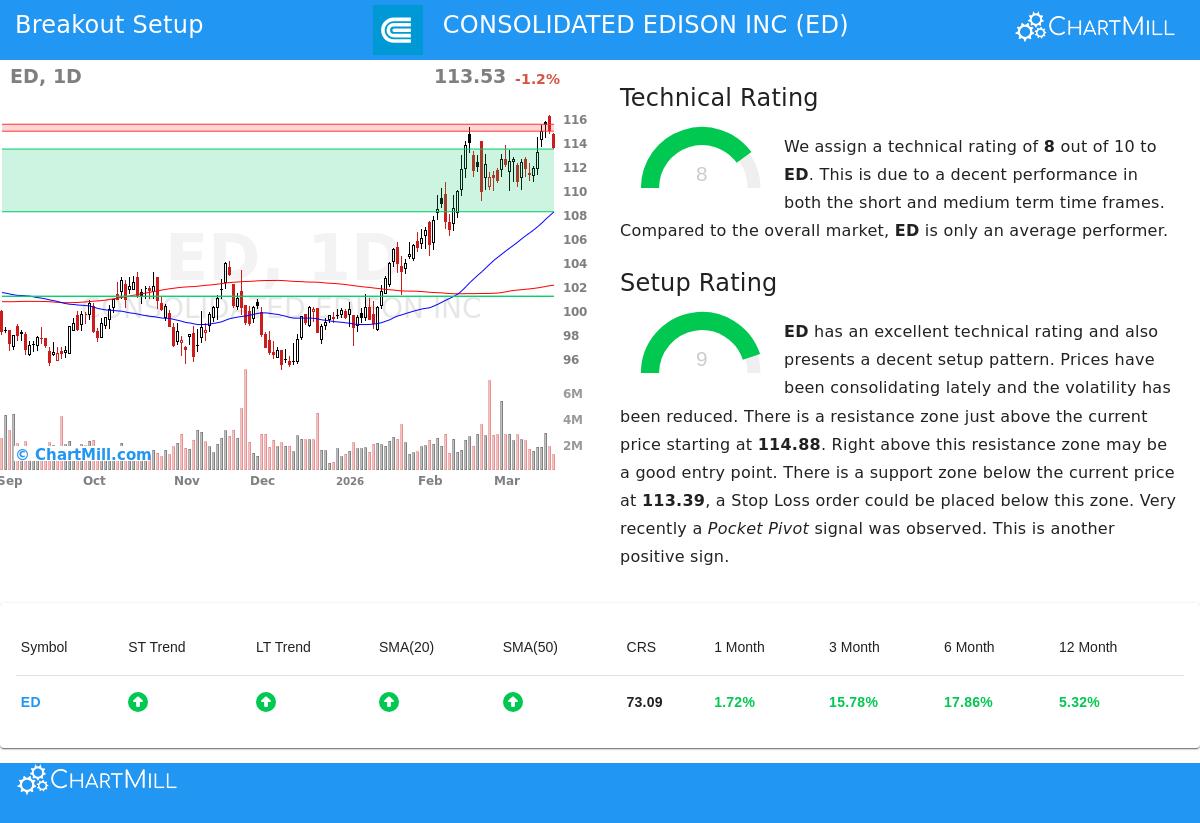
Technical Strength: A Firm Base
The first part of the breakout method is a sound technical condition, measured by the ChartMill Technical Rating. A high rating here is important because it shows the stock is in a verified upward trend with good momentum, raising the chance that a breakout will continue instead of failing quickly. Based on the latest technical report, ED receives a solid rating of 8 out of 10. This score is backed by a few main points:
- Good Trends: Both the recent and longer-term trends for ED are rated as good, a pairing that offers a helpful condition.
- Sound Moving Average Setup: The stock is priced above all its main moving averages (20, 50, 100, and 200-day SMAs), and each average is also rising. This layered setup of support levels is a clear sign of a working uptrend.
- Relative Performance: ED is trading in the higher part of its 52-week range and has done better than 73% of the total market over the past year. This shows relative performance, a main part of the Technical Rating, particularly significant in a market where the S&P 500's longer-term trend is poor.
This technical condition supplies the needed background. It indicates that any possible breakout is happening within a stock already in a clear uptrend, not trying to change a downtrend.
Setup Quality: The Pattern for a Possible Move
The second vital part is the state of the present price pattern. A high ChartMill Setup Quality Rating addresses the question of when to think about buying, finding times of sideways action where price swings lessen and the stock prepares for its next directional move. ED now has a very good Setup Rating of 9 out of 10.
The technical report lists the features that lead to this high setup score:
- Recent Sideways Action: Over the last month, ED has traded between about $109 and $116. It is now placed in the middle of this range, having moved down from the highs recently. This tightening action after a rise is a common sign before a possible breakout.
- Clear Support and Resistance: The analysis notes specific technical levels. A notable support area exists between $108.16 and $113.39, made by a combination of moving averages and trendlines. Just above, a resistance area is between $114.88 and $115.46. Having these clear limits creates a defined plan for the trade.
- Supportive Volume Activity: A recent "Pocket Pivot" signal was seen, a volume-based sign suggesting buying, where price rises on volume greater than the largest down volume of the previous ten days. This can be a small hint that knowledgeable buyers are entering.
A Possible Breakout Situation
The pairing of a solid technical rating (8) and a good-quality setup (9) outlines a specific short-term situation. The automated analysis proposes a possible trade setup where a move above the noted resistance area, specifically above $115.47, could act as a signal to buy. A stop-loss order set below the nearest support area, near $109.99, would then set the trade's possible loss, calculated at about 4.75% in this case.
This form shows the breakout method: wait for the stock to show it can pass the immediate overhead supply (resistance) with the solid technical trend as context, while using the recent sideways period's support level to control risk.
Finding Other Chances
The filter that found Consolidated Edison Inc as a candidate is used each day to search the market for stocks showing this pairing of technical condition and setup quality. Investors searching for similar possible breakout setups can see the present results using the Technical Breakout Setups screen.
Disclaimer: This article is for information only and is not investment advice, a suggestion, or an offer or solicitation to buy or sell any securities. The trade setup discussed is an automatically created example for illustration. All investing and trading has risk, including the possible loss of the amount invested. Investors should do their own separate research and talk with a qualified professional before making any investment choices. Past results do not guarantee future outcomes.