
For investors who use charts and price action to guide their choices, a methodical way to find possible trades is important. One method looks for stocks that are both technically sound and making a clear pattern, indicating a possible breakout may be close. This tactic centers on two main proprietary measures: the ChartMill Technical Rating, which judges the general condition and direction of a stock, and the ChartMill Setup Quality Rating, which examines the condition of its present consolidation pattern. By merging these scores, investors can sort for equities that are both in a solid uptrend and moving in a narrow band, possibly preparing for the next upward move.
A recent scan using this method has identified Century Aluminum Company (NASDAQ:CENX) as a candidate deserving further examination from a technical viewpoint. The company, a leading producer of primary aluminum with operations in the U.S. and Iceland, seems to be matching several important technical conditions that frequently come before notable price changes.
Technical Strength: A Base of Momentum
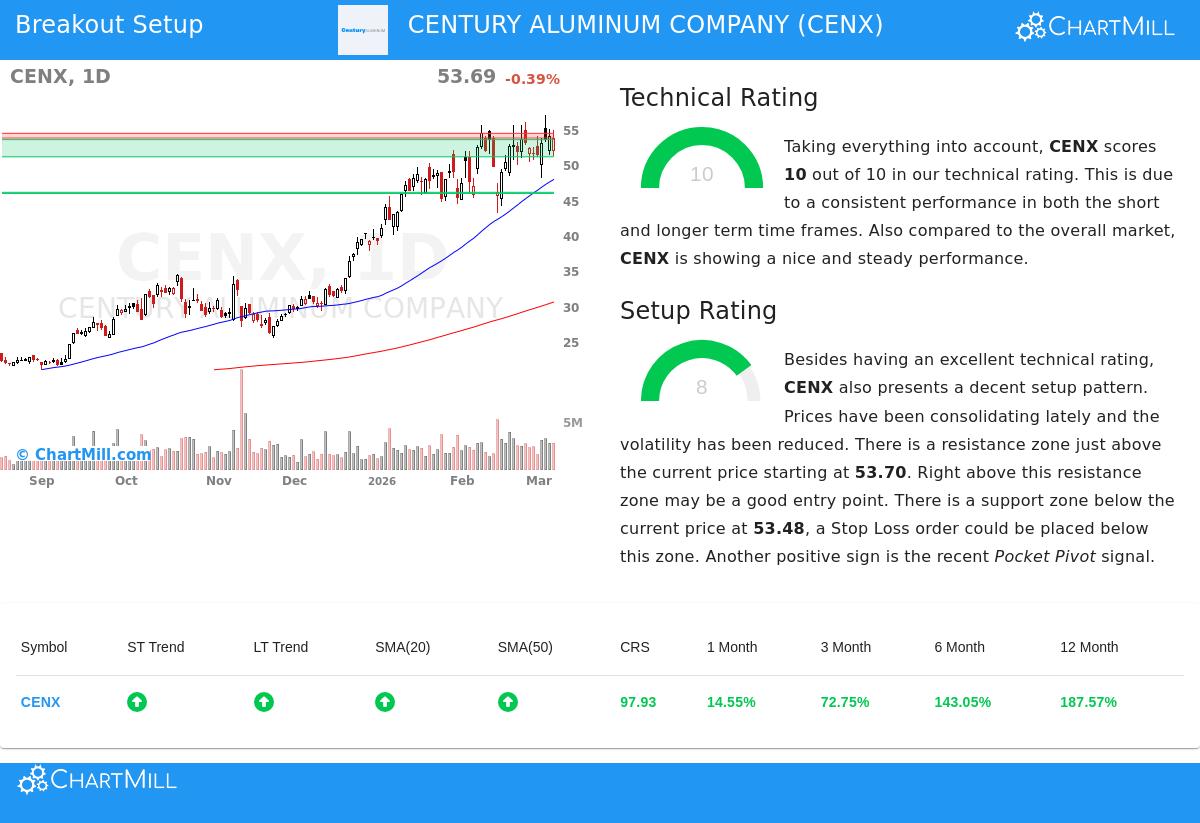
The foundation of this breakout tactic is first confirming that a stock is in a verified and lasting uptrend. This is exactly what the ChartMill Technical Rating measures, and for Century Aluminum, the score is the highest possible. The stock receives a perfect rating of 10 out of 10, putting it with the market's technical frontrunners.
An examination of the full technical report shows the sources of this soundness:
- Strong Trend Agreement: Both the long-term and short-term trends for CENX are scored as positive. This confirmation across multiple timeframes is a standard sign of a sound, trending stock and lessens the chance of opposing trend interference.
- Notable Relative Performance: The stock's price movement is not happening alone. Compared to the wider market, CENX is showing very good relative strength. It has done better than 97% of all stocks over the last year and is in the top 16% of its Metals & Mining industry group.
- Backing from Moving Averages: The stock is priced above all its main simple moving averages (20, 50, 100, and 200-day), and each of these averages is itself in an upward arrangement. This layered agreement of support levels is a solid bullish sign.
- Market Frontrunner Status: CENX is presently trading near its 52-week high. On the other hand, the S&P 500, while in a positive short-term trend, stays in a negative long-term trend and is not approaching new highs. This difference indicates CENX is showing leadership and soundness separate from a rising general market.
This solid technical foundation is necessary for the tactic because it raises the likelihood that any breakout from a consolidation pattern will continue in the direction of the existing, strong trend.
Setup Quality: The Pattern Before the Break
A strong trend by itself is not a signal to buy; entering a stock that is "stretched" or overbought can result in quick declines. This is where the Setup Quality Rating is vital. It finds times of consolidation or "tightening" inside the larger trend, where volatility lessens and the stock gathers energy for its next move. Century Aluminum shows a Setup Rating of 8, meaning a sound pattern is present.
The technical report lists the features of this setup:
- Consolidation in a Band: Over the last month, CENX has been trading between about $43 and $57. It is now located near the top of this band, having recently moved back from the high, which is common action before a possible breakout try.
- Clear Support and Resistance: The analysis finds a definite support area between $51.05 and $53.48, made by a combination of moving averages and trendlines. Just above the present price sits a defined resistance area between $53.70 and $54.37. This makes a clear structure for the trade: a breakout above resistance could indicate the next upward move, while a failure that breaks support would cancel the setup.
- Lessened Volatility & Positive Signs: The report mentions "lessened volatility while prices have been consolidating," a key element for a dependable setup. Also, a recent "Pocket Pivot" sign, a volume-supported price move showing accumulation, was seen, adding another piece of positive confirmation.
This high setup score addresses the "when" question for technical investors. It indicates the stock is not in a disordered, uncertain state but is instead forming an organized pattern with clear risk and reward limits.
A Sample Technical Trade Structure
Based on this examination, the technical report describes a hypothetical trade setup that fits with breakout ideas. It proposes an entry point just above the noted resistance area at $54.38, using a buy-stop order to verify the breakout has force. To control risk, a stop-loss order is suggested just below the main support area at $51.04. This plan seeks to join a verified breakout while clearly restricting downside risk if the pattern does not work.
Finding More Possible Breakout Candidates
The process that found Century Aluminum can be used methodically to the whole market. For investors wanting to see a new list of stocks that fit similar conditions of high technical and setup ratings, the Technical Breakout Setups screen is refreshed each day. You can view the present results and perform your own study via this link.
Disclaimer: This article is for information only and does not form investment guidance, a suggestion, or an offer to buy or sell any security. The technical examination and sample trade setup are based on past data and automated measures, which are not assurances of future results. Investors should perform their own study, think about their personal financial condition and risk comfort, and talk with a qualified financial advisor before making any investment choices. Trading securities involves risk, including the possible loss of principal.