
In equity investing, methods that join fundamental and technical study can give a useful structure for finding chances. One such method is to look for good growth stocks that are also showing hopeful technical breakout shapes. The idea is simple: the fundamental study finds firms with good and speeding business results—strong sales and earnings growth, firm profit, and sound money standing. The technical study then tries to find a good time for entry, searching for a stock that is holding steady after a time of low performance and displaying marks of moving above important price barriers. This meeting points to a firm with good basic business health might be near fresh investor attention and price gain. One stock that lately came up from such a search method is CBRE Group Inc - A (NYSE:CBRE).
Fundamental Growth Picture
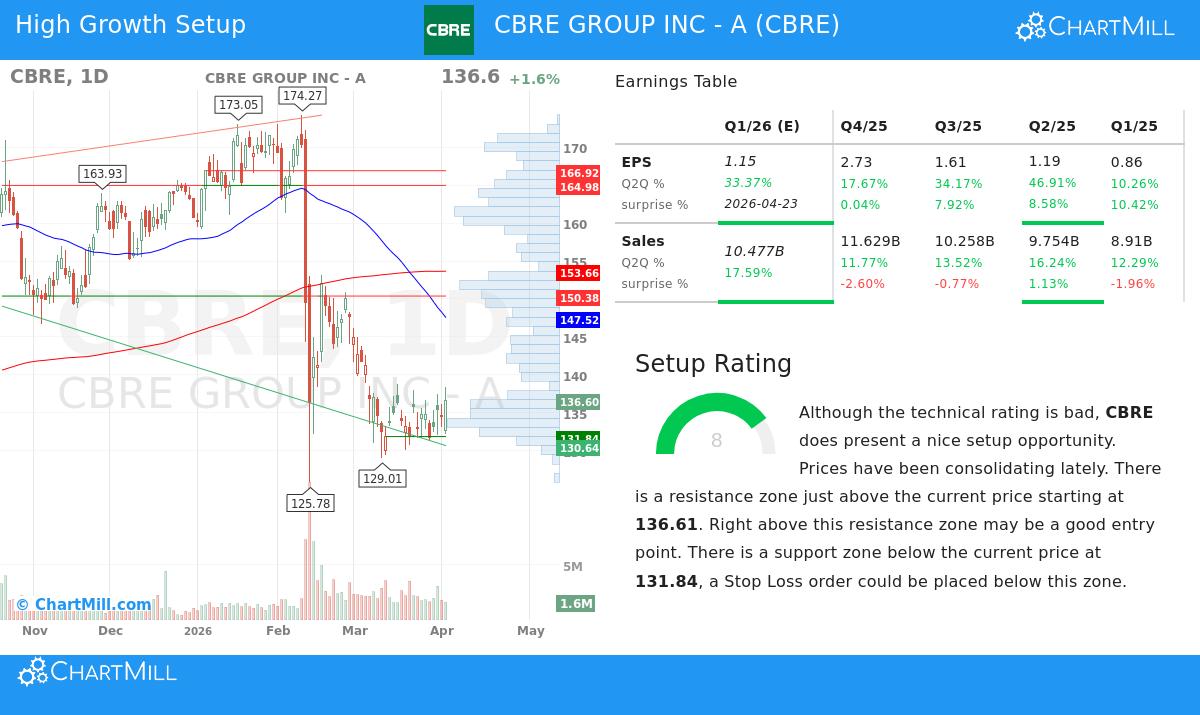
The heart of this method depends on finding firms with better growth paths, and CBRE’s fundamental report gives a firm base for this check. ChartMill gives CBRE a Growth Rating of 7 out of 10, showing results much above normal compared to its industry group in Real Estate Management & Development.
The firm’s recent results show this rating:
- Earnings Per Share (EPS) grew by a notable 25.05% over the last year, with an average yearly growth rate of 14.27% over several years.
- Revenue rose by 13.38% in the last year, keeping a good average yearly growth rate of 11.22%.
Looking forward, experts think this speed will keep going, with expected yearly EPS growth of almost 17% and revenue growth above 9%. This steady and speeding growth is a main screen for the method, as firms growing at this speed can often get higher market prices over time. Also, CBRE’s fundamental soundness is backed by a Profitability Rating of 6 and a Financial Health Rating of 5, pointing to a steady operating and money base from which to support its growth. You can see the full list of these measures in CBRE’s fundamental analysis report.
Technical Pattern and Breakout Chance
While good fundamentals give the "why" for a long-term investment, technical study gives clues about the "when." Right now, CBRE’s total technical rating is low, showing its place in a wider negative market direction. However, the method especially looks for stocks coming out of such low performance, and CBRE’s technical pattern rating of 8 out of 10 points to a possibly good price shape forming.
The stock has been holding steady in a band between about $129 and $139 over the last month, after a big drop from earlier high points. This time of flat movement after a down direction can show a base shape, where selling force eases and the stock forms a base for a possible move up. The technical study finds a clear and close price barrier just above the present price, near $136.61. A clear move above this point, joined by higher trade amount, could mark the end of the holding phase and the start of a new up direction.
This pattern is key to the joined method. It lets investors find a growth stock at a possible turning point, where better technical marks could match the good fundamental story, giving a set risk point (a stop loss set below the support near $131.84) and a clear first price goal. For a close look at the support and barrier points, see CBRE’s technical analysis report.
Valuation Setting
A key part of growth investing is making sure the expected growth is not already fully shown in a too high stock price. CBRE’s Valuation Rating of 5 suggests it is fairly priced within its setting. While its P/E ratio seems high in plain terms, it is clearly lower cost than over 70% of its industry group and trades similar to the wider S&P 500 index. More importantly, its forward P/E ratio and Price/Free Cash Flow ratio are seen as fairly good compared to the industry. When growth is checked via the PEG ratio, which changes the P/E for expected earnings growth, CBRE’s valuation seems fair. This balance stops the stock from being screened out as too costly, a main rule for finding lasting growth chances.
Strategic View
CBRE Group shows an example in the joined fundamental-technical search method. The firm shows the needed fundamental traits the method looks for: very good past and planned growth in earnings and revenue, along with enough profit and financial soundness. Technically, it shows the shape the screen is made to find: a stock with a low recent direction now displaying a positive holding shape near a set barrier point, suggesting a possible breakout is near.
This mix does not promise a win, but it methodically finds stocks where positive business speed might be close to being seen by the wider market through price movement. The present pattern gives a set structure for watching the stock, with a clear point to watch for up confirmation.
, This article is for information only and is not investment advice. The study is based on data and reports from ChartMill.com. Investors should do their own study and think about their personal money situation and risk comfort before making any investment choices. Past results do not show future results.
If you want to look at other stocks that fit this method of good growth fundamentals paired with hopeful technical patterns, you can run the set screen yourself for more results.