
In the field of equity investing, blending separate analytical methods can frequently offer a better structure for finding possibilities. One way is to search for businesses that display good basic business expansion while also showing a positive technical chart formation. This technique tries to match the momentum of a company's financial results with the momentum of its share price, with the goal of identifying stocks as they start a new phase of increase. The process searches for stocks with good basic expansion, earnings, and financial condition, confirming the business is on stable ground. It then adds a technical analysis part, searching for particular breakout formations that indicate a time of sideways movement might be finishing and a new rising trend starting. This article reviews Airbnb Inc. (NASDAQ:ABNB) using this combined view.
Fundamental Strength: The Foundation of Expansion
The first part of this technique is finding a company with a good and expanding business. Based on its fundamental analysis report, Airbnb Inc. (NASDAQ:ABNB) receives a total score of 7 out of 10, with very good scores in the important sections of earnings and financial condition. This is important because even the most hopeful technical situation can fall apart if the basic company is having difficulties. For an expansion-focused technique, the company's growth path is most important.
- Good Earnings: Airbnb has an earnings score of 8. The company's Return on Invested Capital (ROIC) of 23.71% puts it in the best group of its field, doing better than 94% of similar companies in the Hotels, Restaurants & Leisure sector. This shows very efficient use of capital. Also, its earnings margin of 20.51% is higher than 94% of field competitors.
- Very Good Financial Condition: With a condition score of 8, Airbnb shows a very stable balance sheet. A notable point is the company's total absence of debt, giving important financial options and protecting it from increasing interest rate conditions. Its Altman-Z score of 4.12 also points to a very small short-term chance of financial trouble.
- Good Expansion Profile: The company gets an expansion score of 7. While the last year's earnings per share had a small decrease, the longer-term and future views are positive. Income has increased at a yearly rate of almost 30% over the past few years. Looking forward, experts predict good continued expansion, with EPS forecast to rise by about 20% each year.
This mix of high earnings, a very strong balance sheet, and a clear expansion path forms the necessary basic foundation that the search technique looks for. It indicates the company has the operational strength to possibly maintain and support an increasing share price.
Technical Situation: A Formation of Possibility
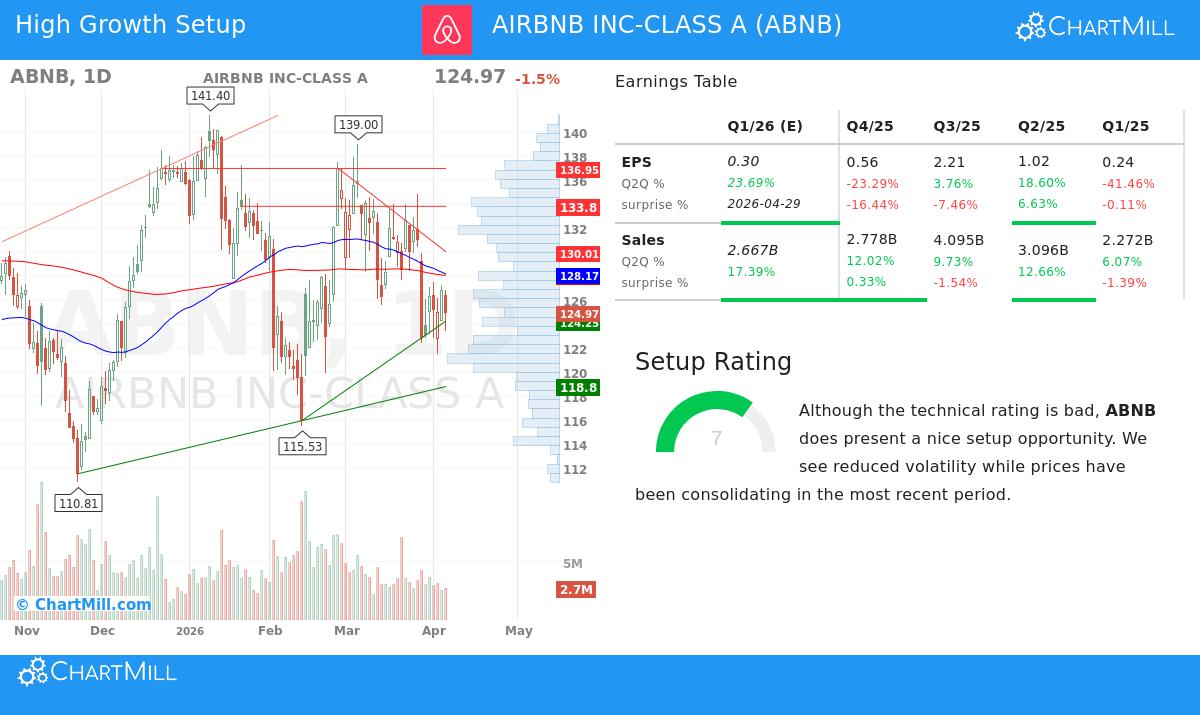
The second part involves evaluating the stock's price movement to find a possible turning point. Airbnb's technical analysis report shows a stock presently in a falling trend but displaying signals of a possible change formation. The total technical score is poor (0 out of 10), showing the negative short and long-term trends. However, the report points out a more detailed "setup score" of 7, which is the important measure for this technique.
- Sideways Movement in a Zone: Over the past month, ABNB has been changing hands inside a set zone between about $121.50 and $134.80. The stock is presently changing hands near the bottom of this zone. This time of little movement after a fall can show a stabilization phase where selling force is taken in.
- Finding Important Points: The technical analysis clearly marks out important support and resistance areas. Key support is found in the $118.80-$118.87 area, made by a combination of trendlines. On the higher side, a major resistance area exists between $126.70 and $130.01, created by a mix of moving averages and trendlines.
- The Setup Possibility: The report ends that in spite of the poor total technical score, ABNB "does show a nice setup possibility," noting "less movement while prices have been stabilizing in the most recent period." For investors using this combined technique, the idea would be that a clear breakout above the $130 resistance area, with high trading volume, could mark the end of the falling trend and the start of a new upward movement, supported by the company's good basics.
Why the Blend Is Important
This merged method is made to handle risk and better the chance of a good investment. Depending only on a technical breakout can be risky if the company's basics are getting worse, as the breakout might be a false signal. On the other hand, buying a basically good company that is in a continuing technical falling trend can try an investor's patience and money as they wait for a cause for action. By needing both situations, a sound, expanding business and a share price coming out of a stabilization formation, the technique tries to find companies where improving price momentum may be starting to show the basic business quality.
Finding Other Possibilities
Airbnb shows an example of a company with very good basic scores in earnings and condition, paired with a technical chart that is forming for a possible change. For investors wanting to use this method to find other possible chances, the set search that found ABNB is ready to review.
You can find more stocks that match this "Strong Expansion Stocks with good Technical Setup Scores" standard by using this stock screener.
Disclaimer: This article is for information and learning only and does not form a suggestion to buy, sell, or keep any security. The review shown is based on data and reports ready at the time of writing and may change. Investing in stocks includes risk, including the possible loss of original money. Always do your own complete research and think about your personal financial position and risk comfort before making any investment choices.