
The investment philosophy of legendary fund manager Peter Lynch, as detailed in his book One Up on Wall Street, focuses on locating well-run, expanding companies that are trading at sensible prices. This "growth at a reasonable price" (GARP) method steers clear of speculative, expensive stocks in favor of businesses with durable expansion, sound financial health, and prices that do not overpay for future prospects. A primary tool for locating such chances is the Peter Lynch stock screen, which selects for companies using standards like a solid but maintainable earnings growth rate, a low price-to-earnings growth (PEG) ratio, good profitability, and a careful balance sheet.
One company that recently appeared from such a screen is WORKDAY INC-CLASS A (NASDAQ:WDAY), a supplier of enterprise cloud applications for finance and human resources. The Pleasanton, California-based company serves more than 11,000 organizations globally, assisting them in managing their workforce, finances, and planning through its AI-driven solutions.
Match with Lynch's Main Standards
The Peter Lynch screen uses particular numerical filters to locate possible investments. Workday's present financial measurements show a solid match with these ideas, indicating it may suit the profile of a Lynch-type "stalwart" expanding at a sensible price.
- Maintainable Earnings Growth: Lynch preferred companies with steady, controlled growth, usually looking for an average yearly EPS growth between 15% and 30% over five years. Workday's five-year EPS growth rate of 26.3% sits directly within this goal range. This shows a strong and maintained rise in profitability, sidestepping the warning sign of extreme-growth that may not be maintainable.
- Appealing Valuation via PEG Ratio: Maybe the most important Lynch measurement is the PEG ratio, which contrasts a stock's Price-to-Earnings (P/E) ratio to its earnings growth rate. A PEG ratio of 1 or less implies the market may not be completely valuing the company's growth path. Workday's PEG ratio, calculated from its past five-year growth, is about 0.49. This very low number indicates the stock might be priced low compared to its historical earnings growth, a primary sign for value-aware growth investors.
- Solid Profitability (ROE): Lynch searched for companies that productively create profits from shareholder equity. A Return on Equity (ROE) above 15% is seen as very good. Workday's ROE of 16.1% reaches this standard, showing that management is productively using invested capital to produce earnings.
- Financial Health (Debt & Liquidity): A careful balance sheet is important for enduring economic slowdowns. Lynch favored companies financed more by equity than debt, often aiming for a Debt-to-Equity ratio below 0.6. Workday's ratio of 0.38 shows a sensible capital structure. Also, its Current Ratio of 1.32 indicates it has enough short-term assets to meet its near-term obligations, passing Lynch's basic financial health test.
Fundamental Health Review: A High-Level Summary
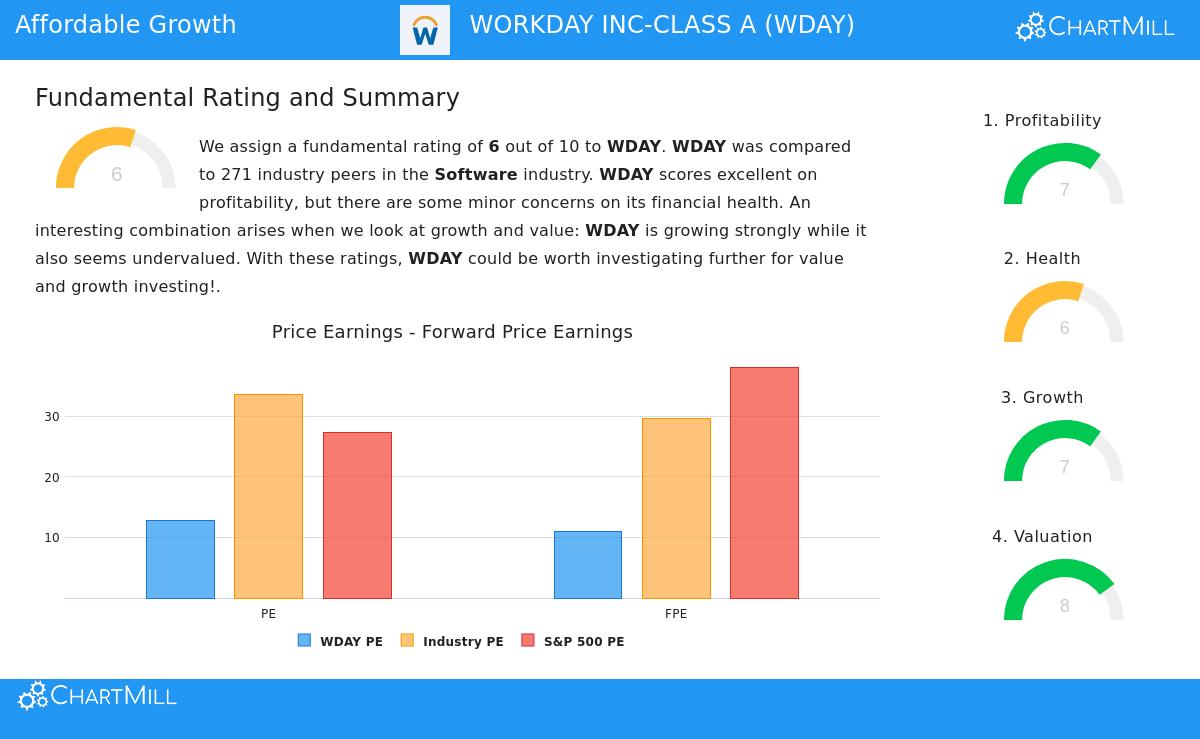
A wider view of Workday's fundamental analysis report on Chartmill gives background to the screen's outcomes. The company gets an overall fundamental rating of 6 out of 10, placing it solidly within the Software industry.
- Profitability is a Clear Positive: Workday scores well here (7 out of 10), with notable measurements. Its Return on Equity (16.1%) and Return on Invested Capital (10.3%) do better than a big majority of its software industry counterparts. Margins are also strong, with an Operating Margin of 16.7% rating with the industry's top.
- Valuation Seems Appealing: The valuation rating is good at 8 out of 10. Workday trades at a P/E ratio of 12.8, which is less expensive than 83% of its industry and much below the present S&P 500 average. Its Price/Forward Earnings ratio of 11.0 and Enterprise Value/EBITDA multiples also indicate a relatively low-cost valuation inside its sector, backing the screen's low PEG ratio discovery.
- Growth Path Stays Positive: The growth rating is 7 out of 10. The company has shown notable past growth in both Revenue and EPS. While analyst forecasts point to a slowing in the future growth rate, it is still expected to be quite solid at over 10% each year for both top and bottom lines.
- Financial Health Displays Small Details: The health score is a fair 6 out of 10. The company's solvency is helped by a very low Debt-to-Free-Cash-Flow ratio, meaning it could in theory pay off all debt in just over a year. However, its Altman Z-score (2.69) puts it in a "grey zone," showing investors should watch overall financial risk, although it still does better than many industry counterparts. The liquidity position, as shown by the Current and Quick ratios, is seen as sufficient.
You can examine the complete, detailed fundamental analysis for Workday here: WDAY Fundamental Report.
Is Workday a Lynch-Type Match?
For investors following Peter Lynch's philosophy, Workday offers an interesting case. It works in the big and necessary market of enterprise software, an area that might be seen as "ordinary" but is basically important to its customers—a quality Lynch liked. The numerical screening results meet the main points Lynch highlighted: maintainable historical growth, a valuation that accounts for that growth (low PEG), high profitability, and a balance sheet not weighed down by debt.
While the screen gives a useful beginning, Lynch always highlighted the need to know the business behind the numbers. Investors would have to study Workday's competitive standing, its capability to keep up growth against competitors like Oracle and SAP, and the long-term demand factors for its combined HCM and finance cloud platforms.
Finding More Possible Investments
The Peter Lynch strategy is made to methodically find companies with these wanted features. Workday is only one instance that met the screen's filters based on recent information. For investors looking to create a varied portfolio of such companies, using the screen often can supply a list of research ideas.
You can locate the present list of stocks meeting the Peter Lynch screen and change the standards to your own choices here: Peter Lynch Strategy Stock Screen.
Disclaimer: This article is for informational purposes only and does not constitute financial advice, a recommendation, or an offer to buy or sell any security. The analysis is based on data and a predefined screening method; it is not a replacement for personal, detailed research. Investing in stocks involves risk, including the possible loss of principal. You should think about your own financial position, investment goals, and risk tolerance before making any investment decision.