
For growth-minded investors, high revenue and EPS growth are key criteria. Today, we'll examine whether WORKDAY INC-CLASS A (NASDAQ:WDAY) fits the bill for growth investing, particularly as it forms a base and hints at a potential breakout. Remember, due diligence is essential, but WORKDAY INC-CLASS A has caught our attention on our screen for growth with base formation. It may warrant additional investigation.
Analyzing Growth Metrics
ChartMill assigns a Growth Rating to every stock. This score ranges from 0 to 10 and evaluates the different growth aspects like EPS and Revenue, both in the past as in the future. NASDAQ:WDAY scores a 8 out of 10:
- WDAY shows a strong growth in Earnings Per Share. In the last year, the EPS has been growing by 39.62%, which is quite impressive.
- Measured over the past years, WDAY shows a very strong growth in Earnings Per Share. The EPS has been growing by 33.84% on average per year.
- Looking at the last year, WDAY shows a quite strong growth in Revenue. The Revenue has grown by 17.07% in the last year.
- The Revenue has been growing by 20.80% on average over the past years. This is a very strong growth!
- The Earnings Per Share is expected to grow by 21.06% on average over the next years. This is a very strong growth
- The Revenue is expected to grow by 15.34% on average over the next years. This is quite good.
Assessing Health Metrics for NASDAQ:WDAY
ChartMill employs a unique Health Rating system for all stocks. This rating, ranging from 0 to 10, is determined by analyzing various liquidity and solvency ratios. For NASDAQ:WDAY, the assigned 7 for health provides valuable insights:
- WDAY has an Altman-Z score of 5.67. This indicates that WDAY is financially healthy and has little risk of bankruptcy at the moment.
- WDAY's Altman-Z score of 5.67 is fine compared to the rest of the industry. WDAY outperforms 68.57% of its industry peers.
- The Debt to FCF ratio of WDAY is 1.39, which is an excellent value as it means it would take WDAY, only 1.39 years of fcf income to pay off all of its debts.
- WDAY's Debt to FCF ratio of 1.39 is fine compared to the rest of the industry. WDAY outperforms 70.36% of its industry peers.
- A Debt/Equity ratio of 0.36 indicates that WDAY is not too dependend on debt financing.
- Although WDAY does not score too well on debt/equity it has very limited outstanding debt, which is well covered by the FCF. We will not put too much weight on the debt/equity number as it may be because of low equity, which could be a consequence of a share buyback program for instance. This needs to be investigated.
- WDAY has a Current Ratio of 2.04. This indicates that WDAY is financially healthy and has no problem in meeting its short term obligations.
- WDAY has a Current ratio of 2.04. This is in the better half of the industry: WDAY outperforms 61.43% of its industry peers.
- A Quick Ratio of 2.04 indicates that WDAY has no problem at all paying its short term obligations.
- With a decent Quick ratio value of 2.04, WDAY is doing good in the industry, outperforming 61.43% of the companies in the same industry.
Profitability Examination for NASDAQ:WDAY
ChartMill assigns a proprietary Profitability Rating to each stock. The score is computed by evaluating various profitability ratios and margins and ranges from 0 to 10. NASDAQ:WDAY was assigned a score of 6 for profitability:
- The Return On Assets of WDAY (9.49%) is better than 86.43% of its industry peers.
- With an excellent Return On Equity value of 18.47%, WDAY belongs to the best of the industry, outperforming 88.57% of the companies in the same industry.
- Looking at the Return On Invested Capital, with a value of 2.30%, WDAY is in the better half of the industry, outperforming 71.43% of the companies in the same industry.
- Looking at the Profit Margin, with a value of 19.60%, WDAY belongs to the top of the industry, outperforming 86.79% of the companies in the same industry.
- WDAY has a Operating Margin of 4.34%. This is in the better half of the industry: WDAY outperforms 70.71% of its industry peers.
- The Gross Margin of WDAY (75.77%) is better than 70.00% of its industry peers.
How do we evaluate the setup for NASDAQ:WDAY?
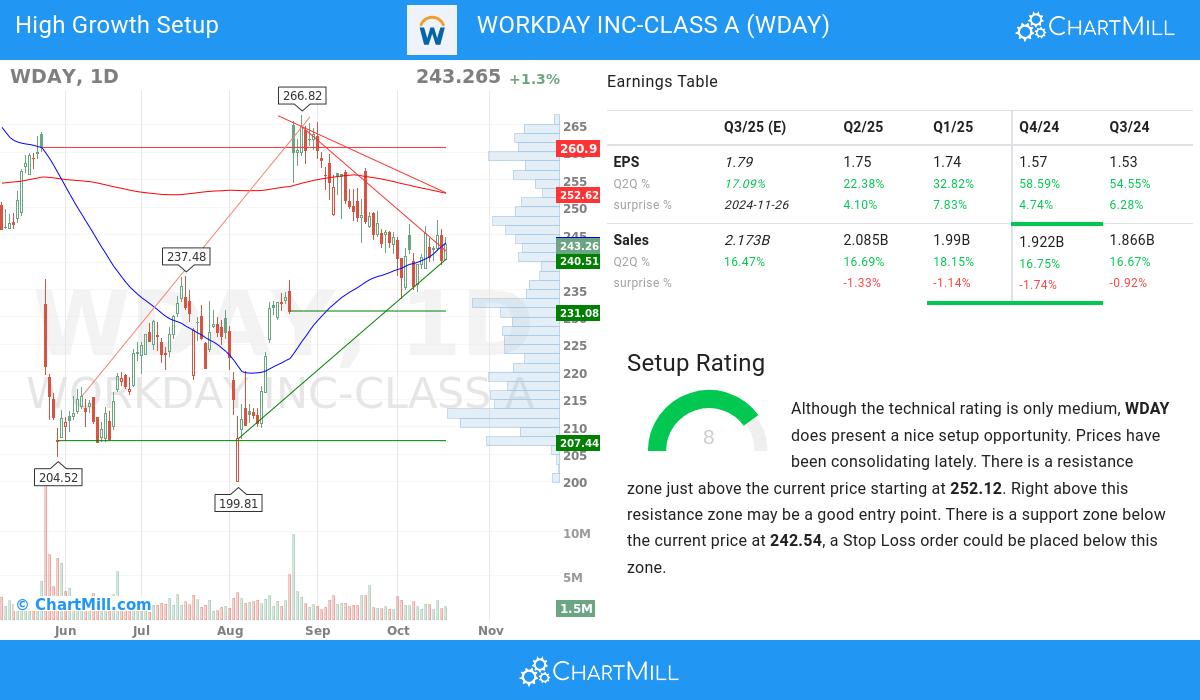
ChartMill incorporates a Setup Rating in its analysis, which measures the extent of consolidation in a stock over recent days and weeks. This rating, ranging from 0 to 10, is updated daily and takes into account multiple short-term technical indicators. The current setup rating for NASDAQ:WDAY is 8:
WDAY has only a medium technical rating, but it does show a decent setup pattern. Prices have been consolidating lately. There is a resistance zone just above the current price starting at 252.12. Right above this resistance zone may be a good entry point. There is a support zone below the current price at 242.54, a Stop Loss order could be placed below this zone.
More Strong Growth stocks can be found in our Strong Growth screener.
For an up to date full fundamental analysis you can check the fundamental report of WDAY
Check the latest full technical report of WDAY for a complete technical analysis.
Keep in mind
Important Note: The content of this article is not intended as trading advice. It is essential to perform your own analysis and exercise caution when making trading decisions. The article presents observations created by automated analysis but does not guarantee any trading or investment outcomes. Always trade responsibly and make independent judgments.