
For technical investors aiming to find stocks ready for their next price increase, a frequent method involves screening for securities that show both solid technical condition and a constructive price formation. This method often uses specialized measures like the ChartMill Technical Rating, which reviews a stock's general trend condition, and the ChartMill Setup Quality Rating, which judges the condition of its present consolidation. The aim is to locate market leaders that are resting after an advance, presenting a possible entry chance before a fresh breakout. One stock that recently appeared from this kind of scan is WEBSTER FINANCIAL CORP (NYSE:WBS).
Technical Strength: A Base of Leadership
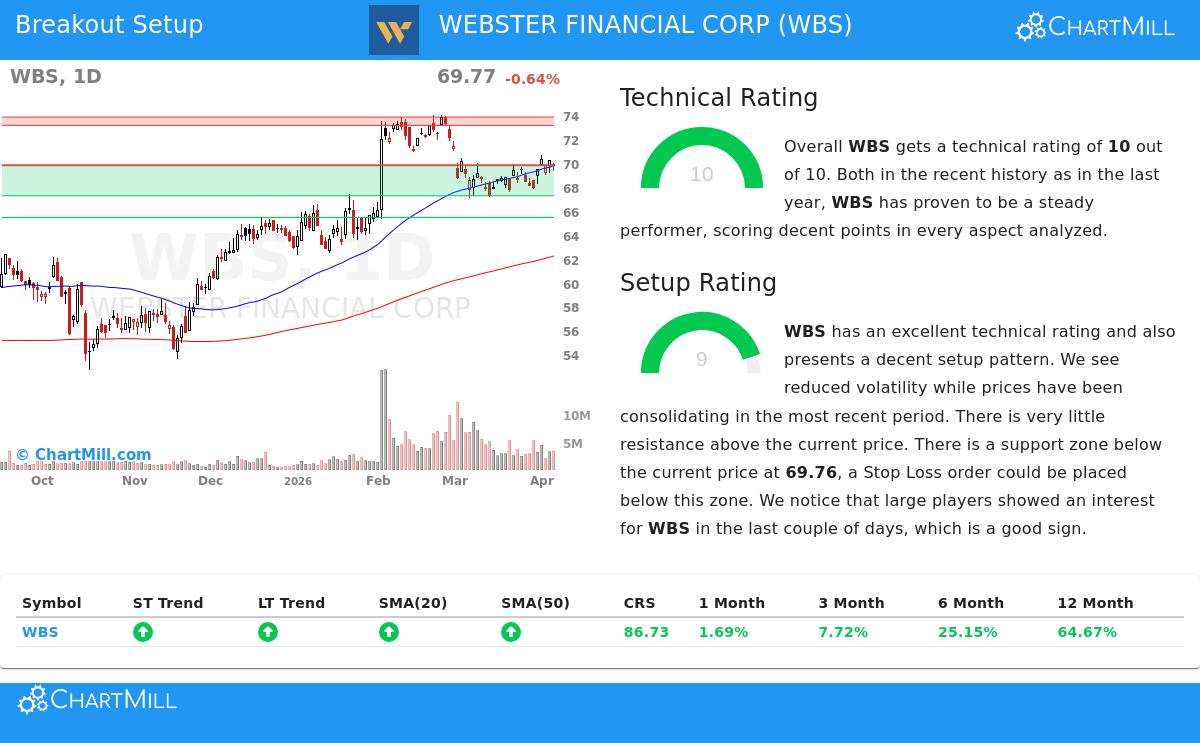
The foundation of this breakout method is first locating stocks with sound basic technicals. A high Technical Rating indicates a stock is in a verified uptrend and is performing better than the wider market, offering a positive condition. Webster Financial receives a top mark here, with a ChartMill Technical Rating of 10 out of 10.
The detailed technical report notes several bases of this condition:
- Trend Agreement: Both the long-term and short-term trends for WBS are scored as positive. This agreement across periods shows continued buying interest and lowers the chance of an opposing trend change.
- Relative Performance: The stock is performing better than 86% of all stocks in the market over the last year and is in the top 9% of its banking industry group. This shows notable relative condition, a main feature of market leaders.
- Moving Average Support: The stock is priced above all its main simple moving averages (20, 50, 100, and 200-day), and each of these averages is itself in a rising pattern. This forms a tiered support structure below the price.
This outstanding technical rating verifies that WBS is not a speculative jump but a stock with a firm and strong uptrend, making it a leading choice for continuation formations.
Setup Quality: The Consolidation Before the Break
A solid trend by itself is not a buy signal; entering after a fast, large advance can be dangerous. This is where the Setup Quality Rating becomes important. It finds times when a stock's price action is becoming tighter, volatility is falling, and a clear support level is being formed, all signs of a consolidation before a possible breakout. Webster Financial shows a high-condition setup with a rating of 9.
The review indicates a standard consolidation formation that fits the method's needs for a lower-risk entry area:
- Narrow Trading Range: Over the last month, WBS has traded in a small band between $67.18 and $70.64. This narrowing in price movement shows a balance between buyers and sellers and often comes before a directional move.
- Clear Support and Resistance: The report finds a definite support area between $67.25 and $69.76, made by a combination of trendlines and moving averages. Directly above, resistance is seen near $69.82. This makes a well-outlined range for traders to work within.
- Lowered Volatility & Institutional Activity: The review mentions much smaller volume lately, which can mean a reduction of selling pressure. Also, it notes activity from large investors, a good sign that often happens alongside accumulation during a consolidation stage.
A Possible Trading Setup
From this technical and setup review, a possible breakout situation is described. The reasoning follows the method's ideas: enter on a verified move above resistance with a protective stop below the formed support.
- Entry: A buy stop order could be set at $69.83, just above the nearby resistance trendline, to verify a breakout from the recent range.
- Exit (Stop Loss): A stop loss order could be placed at $67.84, set below the main support area to contain downside risk if the breakout does not succeed.
- Risk Management: This setup outlines a risk of about 2.85% on the trade. Position sizing tools can then be used to match this trade risk with an investor's total portfolio risk preference.
Locating Additional Chances
The mix of a top technical rating and a high-condition setup makes Webster Financial a clear example of what technical breakout screens are made to locate. For investors wanting to scan for like chances each day, the process that found WBS can be repeated. You can see the present list of Technical Breakout Setups by going to the dedicated screen on ChartMill.
Disclaimer: This article is for information only and is not investment advice, a suggestion, or an offer or request to buy or sell any securities. The trading setup described is an automatic, hypothetical example built on technical measures and is not a promise of future results. Always do your own research, think about your financial position and risk comfort, and talk with a qualified financial advisor before making any investment choices. Past results are not a guide to future results.