
For investors looking to join strong price momentum with solid underlying business growth, methods like Mark Minervini's Trend Template give a structured system. This method sorts for stocks showing forceful technical uptrends, confirmed by moving average arrangements and nearness to new highs, while also requiring quickening fundamental performance in earnings and sales. By adding a "High Growth Momentum" filter to this trend template, the attention tightens on companies that are both in a clear technical breakout and showing the financial capacity to possibly maintain that momentum. This two-part method tries to spot leaders early in their growth phases.
VIEMED HEALTHCARE INC (NASDAQ:VMD) appears as a present candidate that passes this joined filter, offering a case study in matching technical force with fundamental growth.
Technical Match with the Minervini Trend Template
The center of Minervini's plan is the Trend Template, a precise group of technical rules made to guarantee a stock is in a confirmed, lasting stage 2 uptrend. Viemed's chart presently shows a solid match with these ideas:
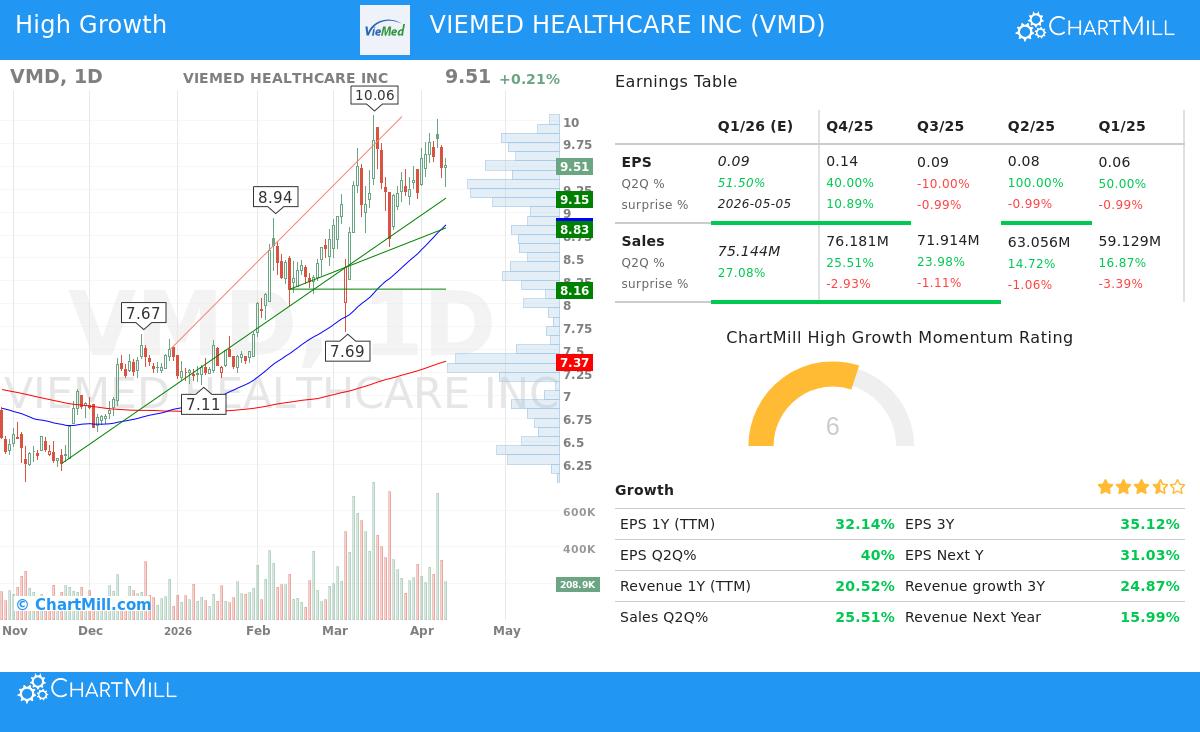
- Trending Above Key Averages: The stock price ($9.51) trades well above its rising 50-day ($8.86), 150-day ($7.57), and 200-day ($7.37) simple moving averages (SMAs). This layered arrangement signals positive momentum across short, intermediate, and long-term periods.
- Moving Average Arrangement: The 50-day SMA sits above both the 150-day and 200-day SMAs, and the 150-day SMA is above the 200-day SMA. This sequential order confirms a sound, set uptrend where shorter-term momentum guides longer-term direction.
- Nearness to Highs: A main rule of the plan is to concentrate on force, not low price. Viemed's price is about 60% above its 52-week low of $5.93 and within 5.5% of its 52-week high of $10.06. This nearness to new highs implies the stock is being bought and meets little overhead supply from past buyers.
- Superior Relative Strength: With a ChartMill Relative Strength (CRS) score of 86.02, Viemed is doing better than 86% of the whole market. Minervini notes that real market leaders regularly show high relative strength, as it signals institutional favor and money coming in even during wider market changes.
This technical view meets the Trend Template's main aim: to spot stocks where the direction of least opposition is upward, thus raising the chance of a good trade.
Fundamental Driver for High Growth Momentum
A technically ideal chart is only part of the account. The "High Growth Momentum" part of the filter looks for the fundamental cause, the improving earnings and sales that usually drive a stock's major rise. Viemed's recent financial numbers show several quickening growth patterns:
- Earnings Quickening: The company displays a sequence of major year-over-year earnings per share (EPS) growth. The latest quarter saw EPS jump 40% against the same time last year. While the quarter before showed a -10% drop, the two quarters prior to that recorded strong increases of 100% and 50%, in order. This uneven but mostly upward path can indicate a business reaching a turning point.
- Solid Sales Growth: Revenue growth supplies the top-line fuel for bottom-line increase. Viemed's sales growth has been steadily forceful, with the last quarter up 25.5% year-over-year. The earlier quarters grew at 24.0%, 14.7%, and 16.9%, signaling a recent quickening in business expansion.
- Growing Profitability: Beyond top-line growth, bettering efficiency is key. The company's profit margin in the last reported quarter was 7.40%, showing a notable increase from 4.89% and 5.01% in the two prior quarters. This implies the company is not only growing revenue but is doing so with more profit, a forceful mix for shareholder value.
- Forceful Annual Patterns: Viewing the full fiscal year, EPS grew over 32%, following 7.7% growth the year before. Annual revenue growth has been stable in the 20-22% range over the past two years, after a time of even quicker expansion.
These fundamental traits match the "High Growth Momentum" filter's goal: to find companies where business momentum is real and probable to draw continued investor attention, giving a fundamental reason for the technical breakout.
Consolidation and Setup Quality
Based on the supplied technical analysis report, Viemed receives a perfect ChartMill Technical Rating of 10, confirming its outstanding trend condition. Possibly more important for entry timing, it has a Setup Rating of 7. This signals the stock is in a time of consolidation inside its larger uptrend, a needed halt that can gather energy for the next move upward. The report states prices have been trading between $8.62 and $10.06 over the past month, with the present price in the middle of this band. This kind of volatility decrease, especially after a forceful prior rise, is exactly the type of pattern Minervini's plan aims to use, as it can provide a lower-risk entry point close to support levels.
A full account of the stock's support, resistance, and a sample trade setup is available in the complete ChartMill Technical Analysis Report for VMD.
Locating Similar Possibilities
Viemed Healthcare shows how the joining of a strict trend template and a high-growth fundamental filter can highlight possible leadership candidates. For investors wanting to use this method to find other stocks displaying similar technical and fundamental fit, the preset screen is ready for use.
You can execute the "High Growth Momentum + Trend Template" screen yourself to see present market candidates by using this link.
Disclaimer: This article is for informational and educational purposes only. It is not a recommendation to buy or sell any security. The analysis is based on provided data and predefined screening methodologies. All investing and trading involves risk, including the potential loss of principal. Always conduct your own due diligence and consider consulting with a qualified financial advisor before making any investment decisions. Past performance is not indicative of future results.