
In the search for promising trading opportunities, many technical investors use systematic screens to filter the market for stocks showing both strong momentum and a good entry point. One method, detailed in ChartMill's resources, focuses on finding "Technical Breakout Setups." This method uses two scores: the ChartMill Technical Rating, which measures the overall condition and trend strength of a stock, and the ChartMill Setup Quality Rating, which evaluates the quality of its current consolidation pattern. The aim is to find stocks that are not only in a good uptrend but are also moving in a tight range, indicating a possible breakout is near. A recent run of this screen has pointed to one such candidate in the energy sector.
Technical Strength: A High-Level Performer
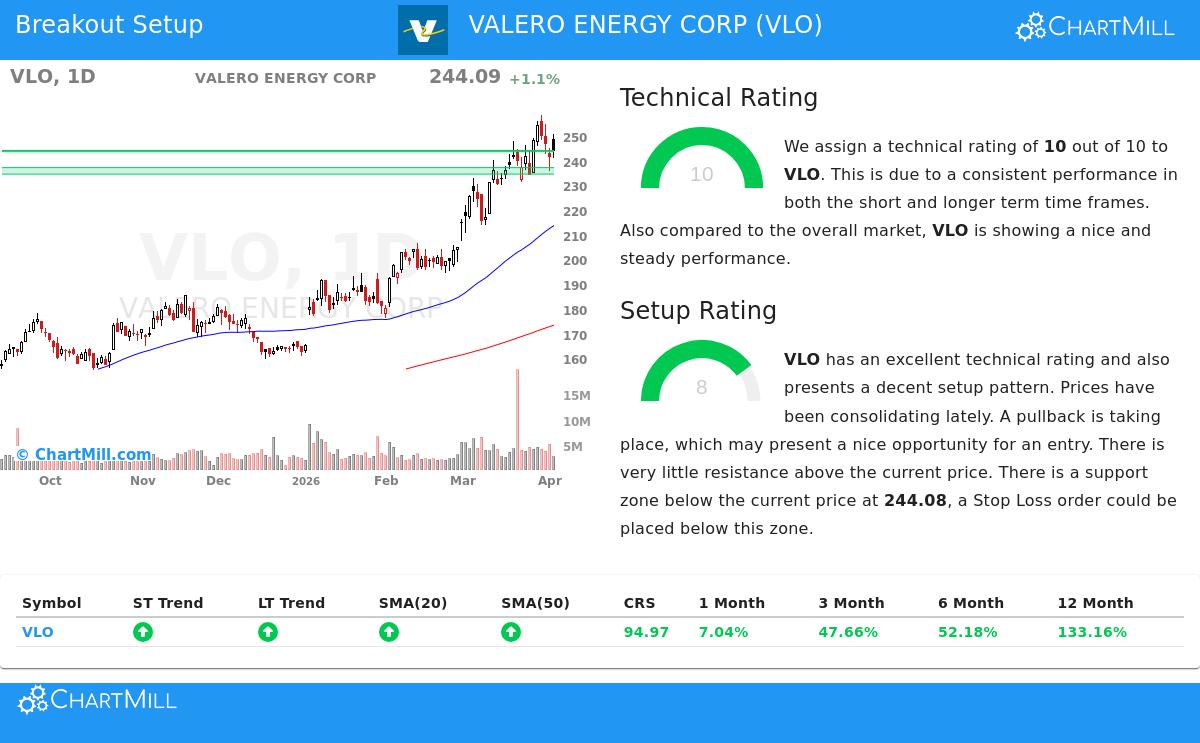
The base of any breakout strategy is a stock with good underlying technicals, and VALERO ENERGY CORP (NYSE:VLO) does well here. According to the ChartMill Technical Analysis report, VLO gets a perfect Technical Rating of 10 out of 10. This high score comes from a strong and steady uptrend across multiple timeframes.
- Trend Alignment: Both the long-term and short-term trends for VLO are positive. This alignment is a main sign of continued momentum, as the stock is rising without major counter-trend pressure.
- Market Position: The stock is now trading near its 52-week high, a positive signal. More notably, it is doing better than the wider market; while the S&P 500 trades in the upper part of its range, VLO is ahead by testing new highs. Its one-year gain of over 133% puts it in the top 6% of all stocks.
- Moving Average Support: The stock price is trading above all its key simple moving averages (20, 50, 100, and 200-day), and each of these averages is itself rising. This layered alignment of support levels is a classic sign of a solid, good trend.
This high technical rating speaks to the first important question for a technical trader: "Which stock should I buy?" It points to VLO as a market leader with a good chance of continuing its upward path, making it a technically sound candidate for more review.
Setup Quality: A Consolidation Presenting Opportunity
A strong trend alone is not a buy signal; entering a stock that has just made a large move can be risky. This is where the Setup Quality score becomes key, answering the second question: "When should I buy it?" VLO has a Setup Rating of 8, showing it is in a period of constructive consolidation.
- Bull Flag Pattern: The technical report states that VLO is now showing a bull flag pattern. This pattern forms when a stock pauses or pulls back slightly in a narrow range after a sharp rise, which can prepare for the next move higher.
- Defined Support and Risk Management: The analysis finds a clear support zone between $243.59 and $244.08, made from a mix of trendlines and moving averages. For a trader, this gives a logical and nearby level to place a protective stop-loss order, clearly setting the risk of the trade.
- Clear Resistance and Entry Point: With very little resistance noted above the current price, the path for a breakout seems open. The automated setup indicates a possible entry point on a move above $258.44, which would be a breakout above recent consolidation highs.
The high setup score confirms that VLO is not overextended but is instead gathering force within its established uptrend. It offers a trader a specific, technically-defined area from which to plan an entry, with a clear level to manage risk if the expected breakout does not happen.
A Candidate for Technical Breakout Observers
For investors using a breakout strategy, VALERO ENERGY CORP presents a notable case. It combines a high-level technical rating, confirming its position as a solid market leader, with a good setup score that indicates a current consolidation phase. This pairing suggests the stock may be getting ready for its next important upward move. The presence of a well-defined support zone allows for exact risk management, a key part of disciplined technical trading.
It is important to recall that technical screens are made to find potential, not assure results. Any trading decision should be based on personal analysis and risk tolerance.
Find More Possible Breakout Setups
The Technical Breakout Setup screen runs daily to find new opportunities across the market. If you want to see the current list of stocks that meet these strict technical and setup conditions, you can review the live results via the Technical Breakout Setups screen.
Disclaimer: This article is for informational purposes only and does not constitute investment advice, a recommendation, or an offer or solicitation to buy or sell any securities. The analysis is based on technical data and automated scoring models, which are subject to change. All investment decisions involve risk, including the potential loss of principal. Past performance is not indicative of future results. You should conduct your own research and consult with a qualified financial advisor before making any investment decisions.