
In the field of growth investing, joining a solid technical plan with strict fundamental review can be an effective way to find possible leading stocks. One organized method is to blend Mark Minervini’s Trend Template, a group of technical rules made to find stocks in clear, steady upward trends, with an emphasis on strong-growth momentum. This two-part plan looks for companies that not only show better price strength and position next to important moving averages but also display quickening business foundations, like profit growth and favorable analyst changes. By sorting for stocks that meet both requirements, investors try to locate choices set up for further strong performance.
VIR BIOTECHNOLOGY INC (NASDAQ:VIR) recently appeared from a scan made on this idea, indicating it deserves more study from investors focused on growth.
Reviewing the Technical Base: The Minervini Trend Template
Mark Minervini’s Trend Template gives a straightforward, rules-based list to confirm a stock is in a verified stage 2 upward trend, which is important for steering clear of downward trends and finding maintained momentum. The template’s main ideas involve the stock’s location compared to its key moving averages, its nearness to 52-week peaks, and its performance compared to the wider market.
A check of VIR’s present technical state shows it matches these strict standards well:
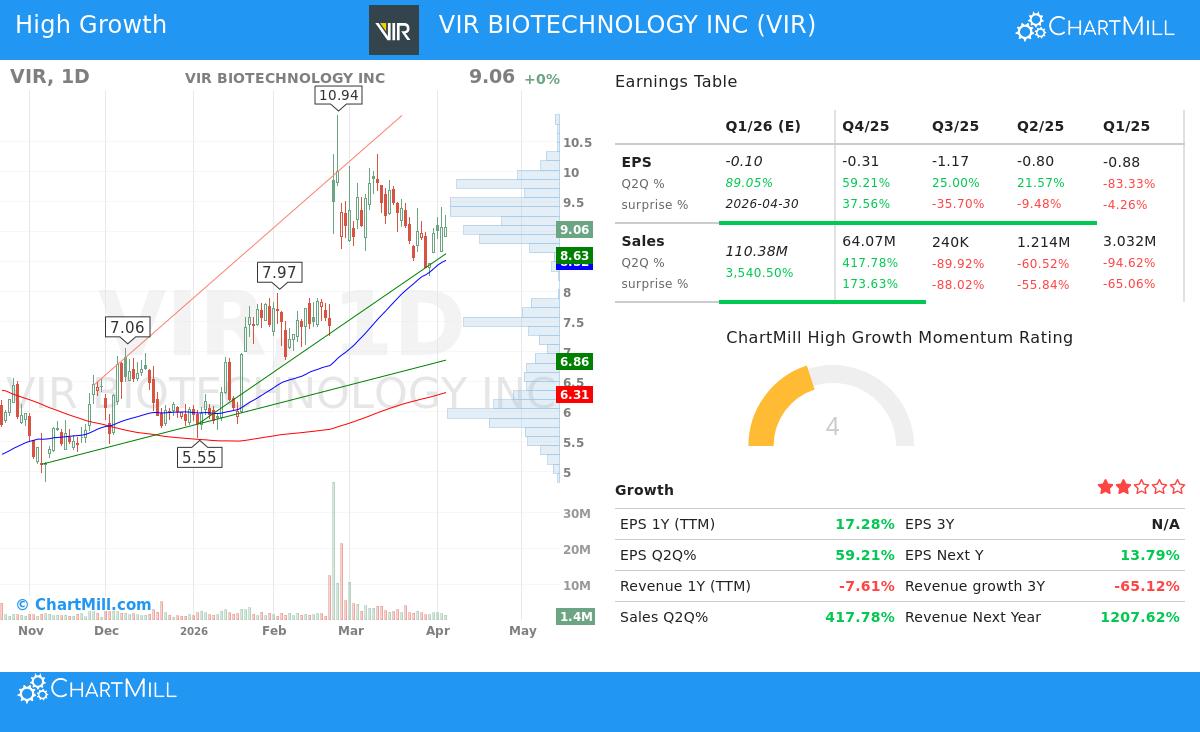
- Price Over Key Moving Averages: The stock’s last price of $9.06 trades over its rising 50-day ($8.52), 150-day ($6.72), and 200-day ($6.31) simple moving averages. This ordered position, with the shorter-term averages over the longer-term ones, is a classic signal of a sound, multi-timeframe upward trend.
- Moving Average Directions: Importantly, these averages are not just price levels but are themselves moving upward. The 200-day moving average, a standard for the long-term direction, has increased from a past value of $6.29 to its present $6.31, verifying continued positive momentum.
- Nearness to 52-Week Highs and Lows: VIR’s present price sits about 118% over its 52-week low of $4.155, easily passing the template’s 30% requirement and showing solid recovery and momentum. While the price is about 17% under its 52-week high of $10.94, it stays within the planned area that indicates the stock is pausing gains while remaining close to leading levels.
- Better Comparative Performance: Possibly most notable is VIR’s ChartMill Relative Strength (CRS) score of 92.32. This means the stock has done better than over 92% of the market, a main Minervini filter for finding industry leaders before they make their biggest moves. High comparative performance is frequently a sign of more strong results.
This combination of technical points meets the automatic scanning steps of the Trend Template, giving a base of price strength from which to review the company’s basic growth situation.
Reviewing the Growth Driver: High Growth Momentum (HGM)
A firm chart is frequently supported by a bettering fundamental view. The High Growth Momentum (HGM) score tries to measure this by studying directions in profits, sales, and analyst opinion. For a clinical-stage biotechnology company like VIR, whose finances can change quickly due to the process of drug creation, specific measures are prominent.
Recent three-month information points to a major positive shift:
- Strong Three-Month Profit Growth: The company’s newest three-month period showed earnings per share (EPS) growth of 59.2% compared to the same three-month period last year. This comes after earlier three-month growth of 25.0%, showing a clear quickening, a design much valued in growth investing.
- Analyst Positive View for Coming Times: Analyst opinion has become clearly positive. Over the last three months, the average guess for next year’s EPS has been adjusted higher by 8.9%, while the sales guess for the next year has seen a large upward adjustment of over 2600%. Such big adjustments often mirror new clinical information, partnership agreements, or a basically bettered view that can work as a strong reason for the stock to move.
- Sales Momentum and Beats: The latest three-month period also showed large sales growth of 417.8% year-over-year. Also, the company has exceeded sales guesses in one of the last four three-month periods. While the yearly sales direction is still negative, usual for biotechs moving between big partnerships or product releases, the strong three-month increase indicates a possible new growth period is starting.
These parts form the "reason" and "foundations" pieces that Minervini’s wider SEPA (Specific Entry Point Analysis) plan looks for. The bettering profit direction, joined with very positive analyst adjustments, gives a fundamental reason that could maintain and lengthen the technical upward trend already present.
Technical Condition and Position Summary
ChartMill’s own technical report gives a combined view, giving VIR a firm Technical Rating of 8 out of 10. The report states both short-term and long-term directions are positive, and the stock is trading in the higher part of its 52-week range while doing better than most of its biotechnology group. The related Setup Rating of 6 indicates that after a recent rise, the stock is in a time of pause. The report finds a clear support area between $8.26 and $8.63, with close resistance near $9.34. This makes a set range for reviewing possible entry points, matching the plan of looking for lower-risk entries inside a set upward trend.
For a full look at the support and resistance levels, and the automatic trade position idea, you can study the complete Technical Analysis Report for VIR.
Locating Like Possibilities
Stocks that fit this mix of technical strictness and growth momentum can be found in an organized way. The scan that found VIR joins Minervini’s Trend Template filters with a minimum High Growth Momentum score, making a focused list for more study.
If you are searching for more possible choices that match this growth-and-trend example, you can study the present results of this scan here: High Growth Momentum + Trend Template Screen.
Closing
VIR BIOTECHNOLOGY INC shows a situation where a major technical move upward, as described by Minervini’s strict template, happens at the same time as a sharp positive change in key fundamental measures and analyst outlooks. The stock’s place over all main rising moving averages, its high comparative performance, and its space from lows give a sound technical base. At the same time, very high three-month sales growth, quickening EPS directions, and greatly upward adjusted guesses present the fundamental reason that growth investors look for. As with any investment, particularly in the changing biotechnology field, this review is a beginning place for more complete personal research, which needs to include a review of clinical trial results, pipeline strength, and general market factors.
Disclaimer: This article is for information and learning only. It is not meant as investment guidance, a suggestion, or a plan to buy or sell any security. The review is based on given information and certain methods, but past results do not show future outcomes. Investing holds risk, including the chance of losing the original amount. Always do your own study and think about talking with a skilled financial advisor before making any investment choices.