
We've identified TEXAS INSTRUMENTS INC (NASDAQ:TXN) as a potential breakout candidate based on our stock screener's analysis. This breakout setup pattern suggests that after a strong uptrend, the stock is currently consolidating, potentially signaling a continuation of the trend. Keep an eye on NASDAQ:TXN for further developments.
Zooming in on the technicals.
ChartMill assigns a Technical Rating to every stock. This score ranges from 0 to 10 and is updated daily. The score is determined by evaluating multiple technical indicators and properties.
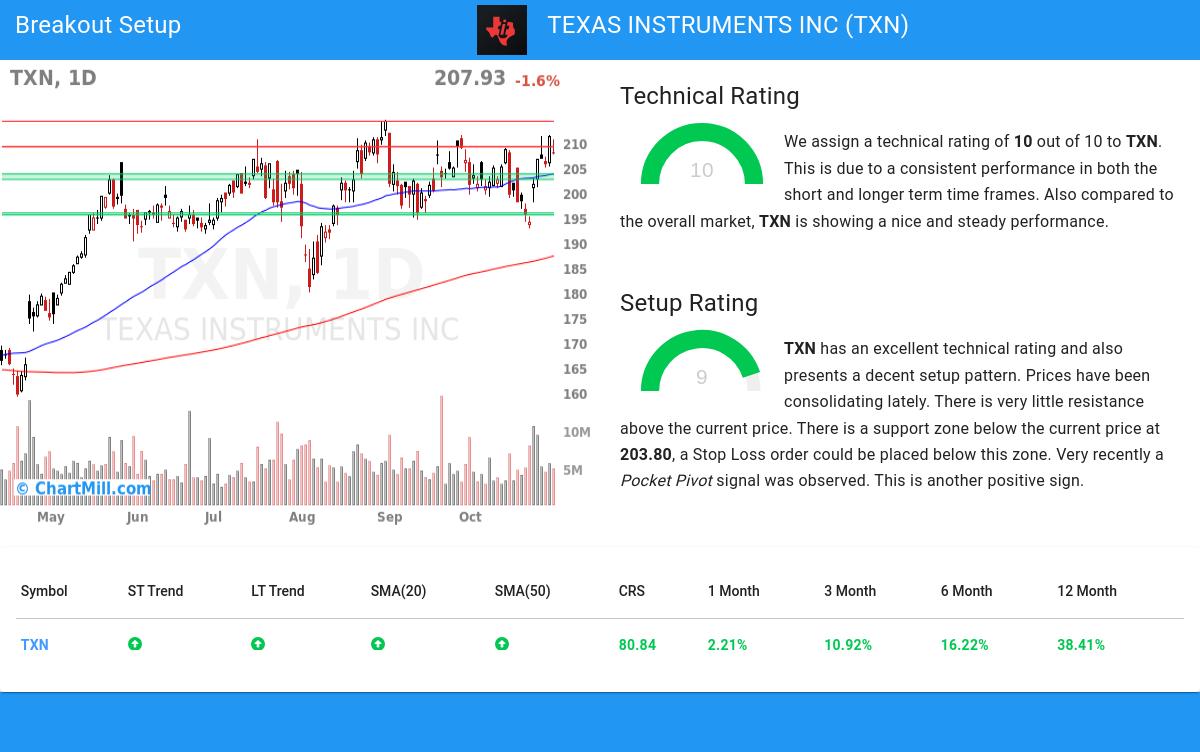
Overall TXN gets a technical rating of 10 out of 10. Both in the recent history as in the last year, TXN has proven to be a steady performer, scoring decent points in every aspect analyzed.
- Both the short term and long term trends are positive. This is a very positive sign.
- When comparing the yearly performance of all stocks, we notice that TXN is one of the better performing stocks in the market, outperforming 80% of all stocks. On top of that, TXN also shows a nice and consistent pattern of rising prices.
- TXN is part of the Semiconductors & Semiconductor Equipment industry. There are 108 other stocks in this industry. TXN outperforms 77% of them.
- TXN is currently trading near its 52 week high, which is a good sign. The S&P500 Index however is also trading near new highs, which makes the performance in line with the market.
- In the last month TXN has a been trading in the 192.85 - 211.59 range, which is quite wide. It is currently trading near the high of this range.
For an up to date full technical analysis you can check the technical report of TXN
How do we evaluate the setup for NASDAQ:TXN?
Besides the Technical Rating, ChartMill assigns a Setup Rating to every stock to determine the degree of consolidation. This rating, ranging from 0 to 10, is updated daily and evaluates various short-term technical indicators. NASDAQ:TXN currently holds a 9 as its setup rating, suggesting a particular level of consolidation in the stock.
Besides having an excellent technical rating, TXN also presents a decent setup pattern. Prices have been consolidating lately. There is very little resistance above the current price. There is a support zone below the current price at 203.80, a Stop Loss order could be placed below this zone. Very recently a Pocket Pivot signal was observed. This is another positive sign.
Trading setups like NASDAQ:TXN
One strategy to consider is waiting for the actual breakout to occur, where the stock breaks out above the current consolidation zone. Traders can then enter a buy position, anticipating further upward momentum. As a risk management measure, it is advisable to set a stop loss order below the consolidation zone.
Of course, there are many ways to trade or not trade NASDAQ:TXN and this article should in no way be interpreted as trading advice. The article is purely based on an automated technical analysis and just points out the technical observations. Always make your own analysis and trade at your own responsibility.
More breakout setups can be found in our Breakout screener.
Disclaimer
This is not investing advice! The article highlights some of the observations at the time of writing, but you should always make your own analysis and invest based on your own insights.