
For investors looking for chances in the market, a disciplined method often requires looking past short-term price changes to find companies trading for less than their inherent value. This method, called value investing, centers on locating stocks that seem priced low by basic measures. A typical screening process involves searching for companies with good financial condition and earnings, paired with a price that looks low compared to similar companies and the wider market. The aim is to find possible investments where the market price might not completely show the actual business quality, giving a buffer for the investor focused on the long term.
Interface Inc. (NASDAQ:TILE), a worldwide flooring company focused on modular carpet tile and resilient flooring, shows a profile that fits this look for reasonable value. The company’s latest fundamental analysis report gives it a total score of 7 out of 10, with notable good points in its financial base and operational performance, while being priced at a lower level.
Valuation: An Interesting Entry Point
The central idea of value investing is buying a dollar’s worth of assets for fifty cents. For TILE, the valuation numbers imply the market may be setting a cautious price on the company. The ChartMill Valuation Rating for the stock is a good 7.
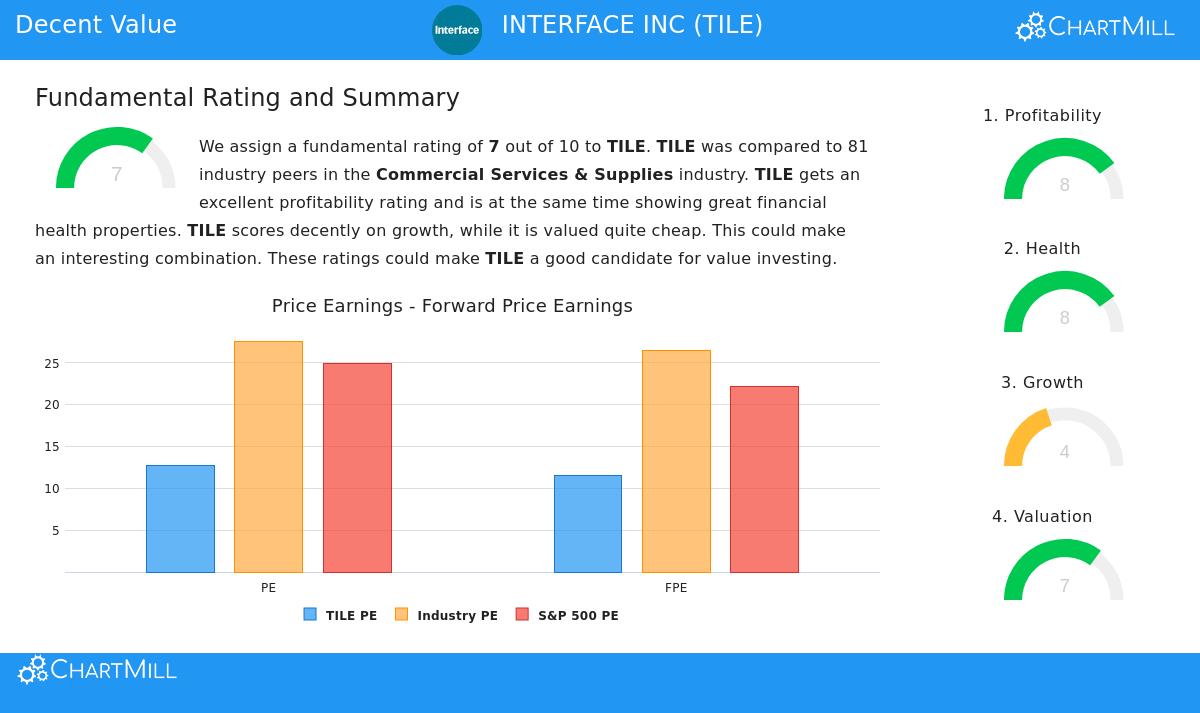
- Price-to-Earnings (P/E) Ratio: At 12.68, TILE’s P/E ratio is much lower than 84% of similar companies in the Commercial Services & Supplies industry, which has an average P/E of 27.56. It also rests below the present S&P 500 average of about 24.89.
- Forward P/E and Cash Flow: The valuation picture continues with future-looking numbers. With a Price/Forward Earnings ratio of 11.53, TILE is priced lower than 85% of its industry. Its Price/Free Cash Flow ratio also points to a fairly low price compared to over 81% of industry rivals.
- Enterprise Value: The Enterprise Value to EBITDA ratio adds to the argument, showing TILE is valued lower than 83% of its industry peers.
For a value investor, these numbers are important. They show that, based on common earnings and cash flow measures, investors are paying less for TILE’s business results than for most similar companies, possibly giving that desired buffer.
Financial Health: A Strong Base
A low-priced stock is only a sound investment if the company is financially stable. A good balance sheet lowers risk and gives steadiness, which is crucial for a long-term value holding. TILE does well here, receiving a ChartMill Health Rating of 8.
- Solvency: The company shows high solvency with a low Debt to Free Cash Flow ratio of 1.57, meaning it could pay off all its debt in less than two years using its present cash flow, a ratio that is better than 86% of the industry. Its Debt/Equity ratio of 0.28 shows a sound mix of debt and equity financing.
- Liquidity: With a Current Ratio of 2.34, TILE has more than enough short-term assets to meet its short-term debts, a standing better than 77% of similar companies.
- Bankruptcy Risk: An Altman-Z score of 4.05 shows no immediate threat of financial trouble and is better than 77% of industry companies.
This sound financial condition means the company is in a good position to handle economic slowdowns, put money into its business, and give capital back to shareholders, all of which guard the value investor’s initial investment.
Profitability: Quality at a Lower Price
Value investing is not about buying weak companies inexpensively, it is about buying good companies at a low price. TILE’s operational strength is clear, shown in a ChartMill Profitability Rating of 8. The company is not just continuing but making good returns on its capital.
- Return Metrics: TILE’s Return on Invested Capital (ROIC) of 14.21% is very good, doing better than 86% of the industry and showing efficient use of capital to make profits. Its Return on Equity (18.12%) and Return on Assets (9.62%) are also near the top in its sector.
- Good and Getting Better Margins: The company has a Profit Margin of 8.37% (top 81% of industry) and an Operating Margin of 12.31% (top 79% of industry). Significantly, both margins have shown pleasing increase in recent years.
This steady and high profitability is a main point of difference. It implies the company has a lasting competitive edge, a "moat," that lets it make better-than-average returns, a trait greatly valued by value investors like Warren Buffett.
Growth: A Steady Path
While strict value stocks occasionally lack increase, TILE shows a steady and positive path, getting a ChartMill Growth Rating of 4. The view is varied but has good parts that add to its valuation story.
- Earnings Growth: The company has shown strong increase in Earnings Per Share (EPS), rising by 33.56% over the last year and by an average of 13.40% each year over recent years. Experts think this EPS increase will keep going at a fairly strong average of 8.73% per year in the future.
- Revenue Difficulties: The main point to note is a 13.61% drop in Revenue over the past year, though the long-term average yearly revenue increase stays positive at 4.68%. Future revenue is thought to increase at a steady rate of about 5%.
For a value investor, the notable earnings increase, even with recent revenue challenges, shows good cost control and operational performance. The expectation of steady future increase suggests the business is not in long-term decline, which helps lower the risk of a "value trap."
Conclusion
Interface Inc. (TILE) presents a situation where good business basics meet a lower market price. Its very good profitability and financial condition point to a quality business, while its valuation numbers trade at a notable discount to both its industry and the wider market. The company’s capacity to grow earnings adds an active part to the value case. This mix of features, a financially strong, profitable company available at a low price, is exactly what searches for "reasonable value" try to find.
Investors curious about finding other companies that match this profile of good valuation along with reasonable basics can locate more possible choices using the Decent Value Stocks screen on ChartMill.
Disclaimer: This article is for information only and does not make up financial guidance, a suggestion to buy or sell any security, or a support of any investment plan. The study is based on data and reports thought to be dependable, but its correctness cannot be assured. Investors should do their own complete research and think about their personal financial position and risk comfort before making any investment choices.